View PDF of this report.
Executive Summary
This paper provides an analysis of how current and projected climate change risks are affecting production and trade by the major cereal producers, exporters and importers in international markets. We focus on maize (corn), rice and wheat, which together account for the largest share of global food staples and over 60% of global food calories. Climate scientists hold divergent views on the exact impact of climate change on factors such as warming temperatures, rainfall, production patterns and crop yields. Yet, current trends in warming and changing rainfall patterns are detrimental to the tropical and subtropical areas of Africa, the Middle East, South Asia and Southeast Asia, and advantageous to countries, such as Canada, Finland, Ireland and Russia.1 With cereals production, there are mixed views on the impact of climate change for major producers, such as the United States. Notable trends are as follows:
-
A review of climate studies, including the United Nations Intergovernmental Panel on Climate Change’s (IPCC) Sixth Assessment Report (AR6), reveals climate-related disruptions for cereals production in all regions, subject to variations.
-
Production from rain-fed agriculture in regions, such as Sub-Saharan Africa (accounting for 95% of the region’s farmland) and the Southern Cone of Latin America, is expected to decline due to seasonal water stress. Decreased production could be mitigated partially through improved water governance, as well as diversified cropping systems.
-
The effects of climate change are occurring sooner than initially projected in regions such as Africa, Asia and Oceania, as evidenced by recurring droughts and flooding.
-
Rice production is particularly vulnerable to climate change, and in the long run, wheat will also experience declines, forcing the relocation of production to higher elevation or the farming of alternative crops.
-
The top 3-5 exporting nations of wheat, rice and maize dominate world markets. In 2022, the top three exporting countries accounted for 64% of maize volumes, 57% of rice and 45% of wheat.2 There is greater diversity among cereal importing countries.
-
Concentration in production and exports poses risks of price volatility and supply disruptions due to climate change and anthropogenic challenges. Overreliance on three cereal grains for calories also presents nutritional challenges. Instead, food policy and trade should support dietary diversity.3
-
Globally, an estimated 37% of harvested major crops is used for domestic food crops. The remainder goes to exports, processing, industry or other uses. Although croplands are expanding and yields are increasing overall, the proportion of direct food crops lags.
We offer five key takeaways that should guide national policymaking and international cooperation in support of more resilient food systems
-
Improving domestic and regional food production is a critical risk-mitigation measure for food importers to improve food security. Almost 20% of global calories consumed are provided by food trade. Major food importers, such as China, Egypt, Ethiopia and Nigeria, have made strides in strengthening their domestic food production.4 More localized food production and regional sourcing creates shorter value chains and reduces some, though not all, risks of supply disruption. It also reduces greenhouse gas (GHG) emissions related to transportation and preservation of food over long distances.
-
Reducing food loss and food waste is critical to tackling climate change and food insecurity, as well as for more sustainable use of natural resources. Currently, we produce more than enough food to feed the world’s population. However, about 14% of global food production (valued at USD400 billion per year) is lost post-harvest before being sold while another 17% of food is wasted during the retail process and by consumers. Food loss and waste also account for between 8-10% of global GHGs. Investments in policy, industry, on-farm and infrastructure interventions are critical to address food loss and food waste. These interventions include improved supply management, harvest, post-harvest and food handling systems, recycling and modified consumer behavior.
-
Countries should explore agroecological strategies that identify high-yield, biodiverse and low-emission pathways for specific agricultural production systems. To enhance productivity, countries have turned to biotechnology solutions using climate-adapted cereal varieties with resistance to pests and drought. Genetically modified (GM) maize now accounts for nearly 30% of global production. The genetically engineered seeds now most used pose potential human and environmental health risks and exacerbate biodiversity loss.5 In an era of increasingly unstable weather patterns and brittle supply chains, uniformity (both in crops and input suppliers) could create new risks. Instead, we argue for agroecological responses tailored to specific situations that also reduce input costs while increasing yields are needed.
-
Country-level policy should incentivize a climate-adapted and healthy diet-based food system towards 2050 in line with the United Nations Food and Agriculture Organization’s (FAO) recommendations.6 This requires food systems that are future-looking with nutrition, farmer livelihoods and the environment as the drivers of food production and consumption. We advocate for a shift to food production and consumption that is healthy and nutritional and includes fruits, vegetables, pulses and some indigenous cereals, such as millet and sorghum.
-
At country and regional levels, food system reforms should be informed by country and crop-specific studies that examine links between climate variables and staple food production in specific locations.
Introduction
Global food security seeks to achieve transformative changes in food production and global food trade to ensure resilient and sustainable food supply.7 In this paper, we examine the risks presented by climate change to food security and agriculture trade flows, with a focus on maize, rice and wheat.8 The paper comes at a crucial time, as the U.N. World Meteorological Organization (WMO) declared 2023 as the hottest year on record in the past 150 years with global mean temperatures 1.43˚C above pre-industrial levels.9 The paper discusses the ramifications of a warming climate and other weather impacts on production and international trade flows for major cereal producers, as well as the implications of any production changes for major net food-importing countries, especially low-income countries.10 We highlight climate risk mitigation strategies for the production and trade of cereals and argue for a transition to agroecology. Integrated, cross-sectoral approaches like agroecology are critical in the just transition process, reducing the environmental footprint of agriculture to promote healthy ecosystems that ensure food and nutrition security for all.
Agricultural trade policies are hotly contested, at the World Trade Organization (WTO) and elsewhere. This paper does not address those policies, nor does it address the role of corporate power in shaping trade outcomes and the existing agriculture market structures, which are dominated by a concerning trend of increasing corporate concentration by global agribusiness. Instead, we take a step back to survey how production and trade flows are changing under climate change and the implications for food security. To address and mitigate climate risks, we advocate for a just and green transition that supports agroecology, which addresses the problems of the food system from field to plate and the impacts on the natural resource base on which food systems depend, both now and in the future.11 Addressing climate risk in agriculture trade should help transition away from the current industrialized system of agriculture production that is extractive and exploitative, and instead, put the well-being of people — producers, workers and end users of crops and products — and the planet at its center.
Cereals are critical for global food security, but reliance on fewer crops has increased vulnerability
Maize, rice and wheat together provide the largest number of calories and nutrients to humans, accounting for as much as 50% of the population’s diet in some regions.12 From 2000-20, cereals were the most important contributor to human diet in all regions, with shares ranging from 24% in Oceania to 50% or more in regions, such as Africa and Asia (Figure 1).13 These three cereal crops also cover more cultivated area than other crops. A recent analysis shows that only 37% of the harvested area of major crops is used for direct food consumption.14 The balance is directed towards exports, animal feed, biofuels, industry uses such as textiles and pharmaceuticals, processing into products such as soap or alcohol, and seed production. The global harvested area of primary crops increased by 22% between 2000 and 2020 to 1.4 billion hectares.15 Out of this, cereals accounted for more than half the world’s harvested area. An increase in cropland comes at the expense of carbon-rich forests and other natural ecosystems.
Figure 1: Dietary energy supply by region and commodity group (2000-20)
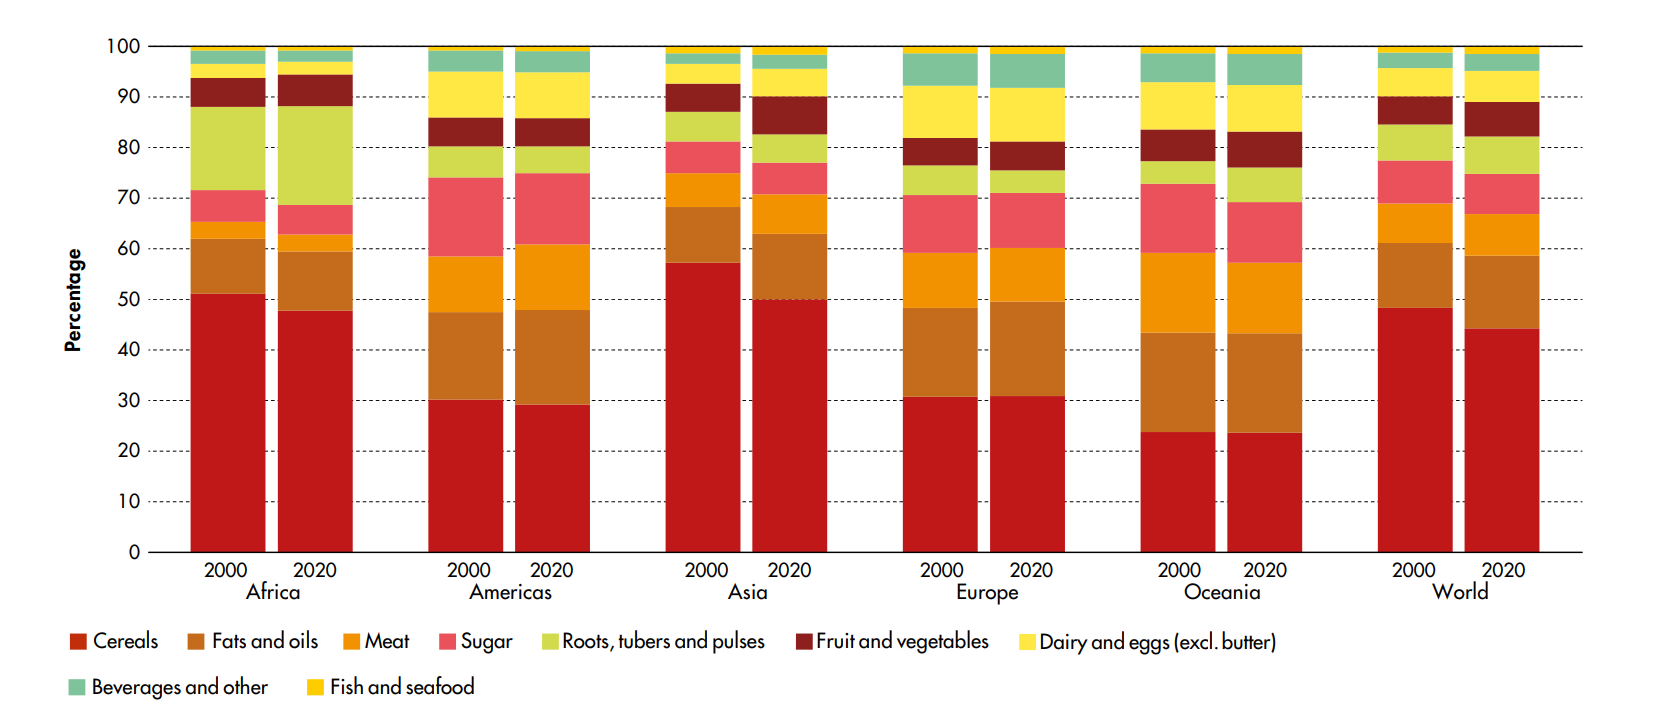
Source: FAO. World Food and Agriculture Statistical Yearbook. Rome, 2022
It is estimated that by 2050 the global population will grow to about 9.8 billion people. The challenge confronting us today is not a lack of food, as the world produces enough food to feed 10 billion people, but rather distribution and access to food or affordability, especially in Low-Income Food-Deficit Countries (LIFDC).16 As illustrated in this paper, global food consumption tends to rely on a handful of crops. Global food markets are also dominated by a handful of major producers and exporters, which increases the vulnerability of the food system to sudden disruptions from both natural (climate) and human-made shocks. In addition, due to climate, poor policies, poverty and other reasons, some regions struggle to achieve food security and self-sufficiency. Across the global food system, there is also a problem of food waste and food loss that results in reduced food supply available on the market and under consumption of available food. We note limited diversity in food supply is complicated by inadequate supply chains and dietary shifts that reduce the amount of healthy, affordable foods available to consumers.
In food systems, FAO estimates that 30-40% of total production is lost before it reaches the market, due to challenges such as improper use of inputs, inadequate proper post-harvest storage, processing or transportation facilities.17 These losses can be as high as 40-50% for root crops, fruits and vegetables, 30% for cereals and fish, and 20% for oilseeds. Food losses and waste within the food system are not the same for rich and poor countries. In poor countries, most food loss occurs at the beginning of the food chain, often in the field due to poor harvesting or as a result of poor storage and transport facilities (made worse by increasing warm temperatures).18 In industrialized countries, the losses occur toward the end of the food chain, where food is wasted in wholesaling, retailing and by consumers, who tend to throw away a significant amount of food. Global food trade plays a role in food loss and food waste as food must travel long distances to markets. Consequently, we argue for stronger local food systems and consumption of traditional foods.
In Sub-Saharan Africa (SSA), as much as 35% of food is lost.19 Diets heavy in cereal-based calories (including many imported cereals00000000000000 such as rice, maize and wheat) are nutrient deficient in other respects, which negatively impacts human health and development. For example, SSA currently has high cereal-based calories and the lowest percentage of calories supplied per capita from protein-rich animal-source foods (8.2%) globally.20 Traditional diets in regions such as SSA were largely plant-based, emphasizing fruits and vegetables, legumes, wild cereals, roots and tubers, supplemented with fish, insects, dairy and meat. Diets shifted dramatically with the advent of colonialism and the introduction of maize in the 1500s, which subsequently emerged as the dominant staple throughout SSA. In recent times, growing rates of urbanization, rising incomes and globalization of food have resulted in increased consumption of obesogenic processed foods and refined carbohydrates. These foods have replaced traditional and more nutrient-rich foods even in developed nations and brought with them more incidences of health issues, such as obesity and other non-communicable diseases.
Climate change threatens food security and impacts global production and trade in cereals
According to the Intergovernmental Panel on Climate Change (IPCC), “climate change” describes a change in the state of the climate, involving shifts in metrological parameters, such as temperature and rainfall, due to natural variability or human activity, that can be identified (e.g., using statistical tests) by changes in the mean and/or the variability of its properties and that persists for an extended period, typically decades or longer. Agriculture’s key factors, such as land (including soil), water and other natural resources (e.g., biodiversity), are all sensitive to weather and climate.21 In recent years, the duration and intensity of droughts and heat stress have increased, reducing agricultural water reserves fivefold.22 Changes such as temperature rises, erratic precipitation and fewer frosts could lengthen or shorten growing seasons, cause variable planting times, allow (or limit) different crops to be grown in some regions and affect how many crops can be produced per year.
Climate change is one of the major threats to food security and to global objectives to end hunger and malnutrition by 2030, as outlined in the U.N. Agenda for Sustainable Development.23 The threat calls for greater focus on adaptation and risk mitigation to maintain consistent food supply.24 Food systems also contribute roughly one-third of global GHG emissions, with two-thirds of that stemming from agricultural production, including meat production, and forestry.25 The World Food Programme declared 2022 the year of “unprecedented hunger” with estimates that 828 million people are hungry.26
While establishing a solid base of national and regional production is imperative, food trade is also critical to national food security strategies, helping overcome shortfalls in local production and broaden the range of foods available to consumers. At the same time, overreliance on global food trade exposes food importers to climate and human-made risks, including dumping, price volatility and supply disruptions due to conflict, for example, the war in the Ukraine.27
Climate change effects on food production are occurring sooner than projected, creating uncertainty around supplies and future food security even among food producing regions
Over the foreseeable future, the repercussions of climate change will lead to an overall decline in crop yields globally if producers continue to grow current crops under status quo conditions. In 2021, scientists described recent global yield projections as “a fundamental shift compared to crop yield projections from the previous iteration of climate and crop models conducted in 2014.”28 Globally, the negative impacts of climate change are uneven, especially within food producing countries and regions with vast land areas, such as the U.S., Africa, Russia and China. There are also variations across different cereals.29 New insights are constantly emerging that require policy discussions among climate and agriculture scientists, farmers, rural communities and policymakers on climate adaptation and risk mitigation to enhance food security.30 Developing reimagined food policies requires ongoing country and crop-specific studies that examine links between climate variables and staple food production in specific locations.31 We highlight findings on the impact of climate change on cereals production from different scientific studies below.
Climate studies suggest that changes in agriculture production (both increases and decreases in output) consistently occur earlier in the new projections than previously expected for several main producing regions before 2040. This heightens our call for urgent action on a transition in agriculture. A 2021 National Aeronautics and Space Administration (NASA) study found that (subject to regional variations) global maize yields are projected to decline 24%, while wheat could potentially see initial growth of about 17%.32 Another study combines trade and climate impact data to investigate the long-term (2070-99) potential impact of climate change on global food trade of wheat, rice and maize.33 The study draws from a variety of climate studies and use a simple network model that highlights the isolated climate-induced cause and effect without adding more complex assumptions. The study analyzes inter alia: (i) whether climate change impacts could disrupt concentration of global cereal production; (ii) how countries might shift their food trade positions in response to climate impacts; and (iii) climate-induced changes in both producing and importing countries. The model looks at present-day and climate-projected trade flows for each crop. The analysis finds that climate change impacts both increase and decrease production, which changes export-import flows by the same percentage. Climate-projected trade flows are calculated by multiplying climate change impact data (%) with current export data (tons).i Changes in export-import flows can result in shifting the structure of trade networks, given that larger volumes of exports and imports point to more concentrated trade. The study finds that, compared to present day, the stability of food trade relationships after 2070 differs between crops, with maize trade the most affected by climate change impacts. The results describe redistribution of global climate risk and forecast that threats to global food security might depend on changing production patterns and resilience efforts across a handful of major global producers, as well as the ability of major importing countries to build resilience to mitigate import loss. Thus, changes in cereal production due to climate change may accelerate dependence on food trade for some countries.
The impact of climate change on agriculture varies with the latitude of targeted regions and the related climate zones, which determine the most optimal growing conditions for crops.34 At the same time, an analysis of climate change from a global perspective can generalize what are otherwise observed spatial variations within a region or country.35 The Köppen-Geiger climate classification, one of the most widely used systems, categorizes five climate groups (and 30 subtypes) based on rainfall and temperature (Figure 2), namely: Tropical climates, Dry climates, Temperate and Continental climates (which overlap), and Polar climates (Arctic and Antarctic regions). The classification is used for ecological modeling or climate change impact assessments.
Figure 2: Simplified map of the world's climate zones
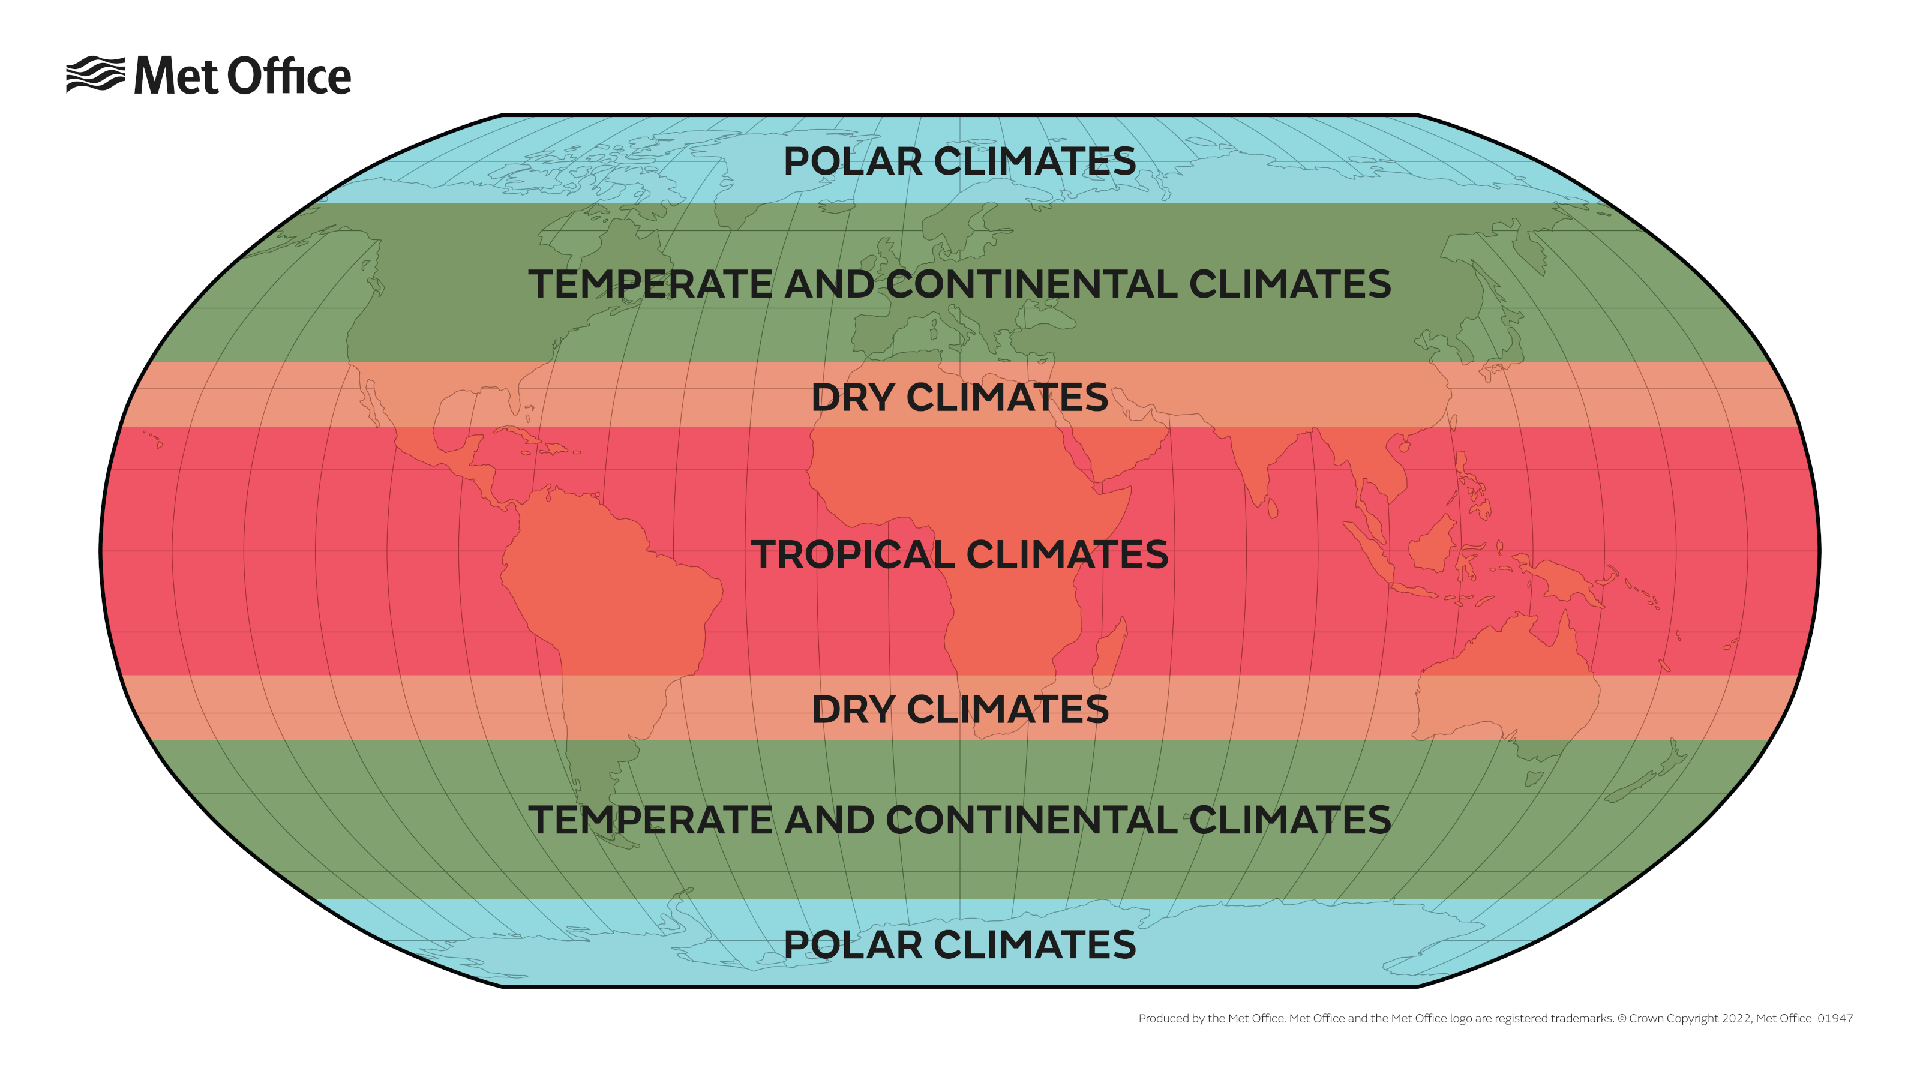
Source: U.K. Met Office. Available online at https://www.metoffice.gov.uk/weather/climate/climate-explained/climate-zones
In tropical (equatorial) regions, which are located around the equator, the weather is characterized by year-round hot average temperatures, humidity and high monthly precipitation, typically no less than 60 millimeters (2.4 inches) per month with annual precipitation ranging over 2,000 millimeters (78.7 inches). The three types of tropical climate are categorized as Tropical Rainforest or Equatorial, Tropical Monsoon and Tropical Wet, and Dry or Savanna. Tropical climates generally experience significant precipitation, and Tropical Wet and Dry and Tropical Monsoon climates experience seasonal shifts in rain patterns. By contrast, north and south temperate zones (which are broadly similar to the Continental climate zones mostly found in Eurasia and North America) are mild temperature areas located between the subtropical and the polar regions. Temperatures in a temperate zone vary greatly between the summer and winter seasons, with the coldest months averaging between 0°C and 18°C (between 32° and 64.4° F).
Some climate scientists agree that present trends in warming and changing rainfall patterns would be detrimental to the tropical and subtropical areas of Africa, the Middle East, South Asia, and Southeast Asia and advantageous to countries including Canada, Finland, Ireland and Russia.36 Specifically on cereals production, scientists hold mixed opinions on the impact of climate change on major producers, such as the U.S. Some scientists conclude that it will be beneficial, and others conclude that it is detrimental.37 Given projections that tropical and subtropical regions will likely be affected to the greatest extent by climate change, it is important to examine the impact of climate change on agriculture in major producing countries and its implications for future food security.
The distribution of Köppen-Geiger climate zones is projected to shift with increased warming.38 Since the 1950s, an estimated 5.7% of the land area has shifted its climate zone classification with estimates that 9-13% of land area might shift climate zones by the end of the century due to increased GHG emissions impacting 14-21% of the global population.39 Notably, the dry arid zone is expanding while the polar zone is contracting; however, changes appear less pronounced for the tropical, temperate and boreal zones.40 Future changes concerning the temperate and boreal zones will be determined by the extent of climate change. The shifting climate zones are expected to produce different outcomes for both people (especially densely populated areas with large populations) and agriculture. For example, densely populated Central Europe, which relies on intensive agriculture, is expected to experience strong impacts.
To ensure tailored climate risk responses, we urge both global and in-depth country case studies that examine the extent of climatic zone change and the impacts of climate change on specific growing subregions. For example, the U.S. is the world’s leading producer of maize (almost exclusively yellow maize). About 43.5% of U.S. maize output is used for animal feed, 44.4% for biofuels (ethanol), and 12% for food, seed and other industrial uses.41 The Southeastern U.S. covers at least 11 states and produces a diverse range of crops. Maize and soy production are significant to the regional economy. However, given its geographical location relative to the Gulf of Mexico and the Atlantic Ocean, the region is highly susceptible to extreme weather and climate-related occurrences, such as rising sea levels, hurricanes/storms, heat waves and extended dry spells.42 Researchers contend that these extreme weather events occur more frequently in the Southeast U.S. than in other regions of the country.43 Moreover, the region faces growing water challenges due to stress on groundwater and seasonal water scarcity, which are expected to worsen by 2050, affecting agricultural production.
A study on the impact of recent climate change on maize, rice and wheat in the southeastern U.S., building on several climate assessments and a panel data set on climate variation (temperature, rainfall and crop yields), looked at the period 1980-2020 and found that, overall, climate change in the Southeast U.S. had a marginal effect on wheat yield, but a 1°C (33.8°F) rise in temperature and increased rainfall resulted in increased maize yield by 13% and rice yield by 14.10%.44 Changing the variable of rainfall significantly reduced wheat yields but had minimal effect on maize and rice yields. With rising temperatures and rainfall variations, these increases will not be sustained in the long run. Moreover, expanded maize production, especially for biofuels and animal feed, is not desirable given the negative environmental impact and underlying incentives for maize production in some major producer nations, which distort planting decisions, induce overproduction, and drive the excessive use of fertilizers that degrade soil and water and harm human health.45
Improving agricultural productivity is often viewed as a means to increase global food security. However, climate change and IATP’s own critique challenges the sustainability of promoting intensive agricultural productivity, especially where it involves intensification through industrialized agriculture, heavy use of fertilizer and poorly managed irrigation. These practices have resulted in declining soil health and biodiversity over time. A recent study by the NASA46 based on 21st-century projections and using the latest-generation crop and climate simulation models identified substantial climate impacts on all major crops coupled with substantial associated uncertainties.47 The study found declining yield responses for maize, soybean and rice due to GHG emissions and warming temperatures. It found that the average global crop yields for maize could decrease by 24% by late century, with declines becoming apparent as early as 2030. The bulk of global maize production is yellow maize. However, developing countries, especially in Africa and Central America, produce and consume over 90% of the white maize produced globally. In contrast, wheat shows stronger gains and a rise in crop yields of about 17%. This change in yields is due to the projected increases in temperature, shifts in rainfall patterns and elevated surface carbon dioxide concentrations due to human-caused GHG emissions, making it more difficult to grow maize in the tropics and expanding the growing range of wheat. The study concludes that “wheat results are more optimistic, while maize, soybean and rice results are decisively more pessimistic.”48 As stated earlier, there is disagreement among crop models, which offer diverging views about the levels of change to be expected in cereal productivity and yields due to climate change at the global level. Ultimately, even where there are gains in production, these gains are short term and unsustainable due to ongoing changes in temperature and rainfall patterns.
The study further highlights that new projections consistently demonstrate climate impacts emerging before 2040 for several main producing regions.49 According to the authors, “While future yield estimates remain uncertain, these results suggest that major breadbasket regions will face distinct anthropogenic climatic risks sooner than previously anticipated.”50 Production from rain-fed agriculture in regions such as Sub-Saharan Africa and the Southern Cone of Latin America is expected to decline due to seasonal water stress. This can be partially mitigated through improved water governance, as well as diversified cropping systems.
The reliance on intensive production of a few cereals to meet food security needs is becoming increasingly risky when set against near and medium-term projections of significant changes in global crop productivity due to climate change.51 These changes will occur decades earlier than previously forecast and place heightened urgency on the importance of food system adaptation and risk management for the present and coming decades. IATP continues to argue for shifting food systems away from harmful intensive industrial animal agriculture to more climate-resilient systems of agroecological food production. Because production of cereals, dairy and livestock are also major sources of emissions and climate change, we recommend changes in food consumption in line with the International EAT-Lancet Commission on Food, Planet, Health Report. Such dietary changes would help reduce reliance on and consumption of cereal staples, as well as the emissions and environmental impacts of producing these foods.
Observations on risk and mitigation from the IPCC’s Sixth Assessment Report (AR6)
The IPCC AR6 identifies negative consequences of long-term climate change on crop yields for some regions, such as declining wheat yields in Europe (with medium confidence), while it states that studies on other regions remain inconsistent.52 The AR6 confirms that the global supply of agricultural products is concentrated across a few breadbasket regions, such as South America, which have the greatest potential to increase the distribution of food supplies to more densely populated regions in Asia, the Middle East and Europe. However, increased production should not come at the expense of deforestation or increased emissions. The report further notes that increased atmospheric concentrations of carbon dioxide reduce the nutritional quality of wheat, rice and other major crops, potentially affecting millions of consumers. Climate adaptation would require the relocation of farming operations to different provinces or higher elevations to produce specific crops or a switch to new farming systems. Countries that are impacted severely and will require substantial adaptive transformation include China, India, Myanmar and the Philippines. Research suggests that by 2030, at least seven provinces in the east and northeast of China will undergo a more than 50% reduction in suitability for maize production, while two northern states in India should expect a 70% drop in suitability. More climate-resilient alternatives, such as cassava and sweet potato, could become essential to food security in these regions.
Around the world, various sectors, including agriculture, have made progress in developing risk management and adaptation responses. In examining the limits of risk mitigation, an assessment of Small Island Developing States (SIDS) highlighted that financial constraints, institutional challenges and poor resource endowments were key inhibitors to adaptation for a range of climate impacts.53 For SIDS and arid regions like the Middle East, Sahel and the Horn of Africa, the limits of geography may constrain the scope for scaling up domestic food production. These regions will continue to depend on food imports for the foreseeable future.
With temperature increases between 1.5°C and 2°C, research referenced in the AR6 report projected sharp regional declines in yield of wheat and maize in Africa, especially for countries including Ethiopia, which is Africa’s second most populous nation with an estimated population of 118 million people. Although it is an agrarian economy with considerable agricultural potential, Ethiopia is a net food importer, importing USD3.4 billion worth of food in 2021-22, which includes cereal grain imports of USD2.2 billion, an increase of 63% on the previous year.54 Some reports cited by the AR6 examined “hotspots” of multisectoral risks with 1.5°C and especially 2°C warming. West Africa, Southeast Asia and Central and northern South America are projected to experience reductions in crop yield, in large part due to shifts in water availability.
3.3 Intensive cereals production is problematic as a major source of emissions contributing to climate change
The share of emissions from agricultural food systems in total global emissions, including from related deforestation and land use, transport and packaging, and fertilizer use, ranges from 25% to 30%.55 Increased agriculture production to meet demand from population growth is projected to increase GHG emissions around 30% by 2050.56 Asian and African countries — the fastest growing population centers — will account for most of this increase in demand in a business as usual scenario involving the increased use of synthetic fertilizers. To use rice as an illustrative example, the International Rice Research Institute notes that rice production is both a victim of and a contributor to climate change.57 Traditional cultivation methods that involve flooding paddy fields and burning rice straw in open fields contribute about 10% of global anthropogenic methane emissions. Synthetic fertilizers are a leading and among the fastest growing contributors to emissions in agriculture dominated by nitrogen (N) emissions, such as ammonia, nitric oxide and nitrous oxide.58 Urea (which supplies 46% nitrogen) is a top-dressing fertilizer that is widely applied to rice crops.59
Chemical/synthetic fertilizer use must be reduced significantly to meet climate targets. Some scientists and civil society organizations, including IATP, advocate for a shift to natural fertilizers derived from organic sources, such as animal manure, compost or plant residues.60 This shift would involve exploring ways to reduce the amount of nutrients lost by optimizing fertilizer application and management (such as improving nitrogen-use efficiency), as well as ways for recovering and recycling lost nutrients from waste. Fertilizer use varies widely globally, depending on the types of crops grown, soil quality and various other factors. In the U.S., close to half of fertilizer applied is used on maize fields.61 Similarly, China is a major cereal producer, and agriculture is the nation’s third-largest contributor of GHG after energy and industry.62 Chinese farmers use an average of 305 kilograms of nitrogen per hectare per year — more than four times the global average — mainly to produce rice, wheat and maize.63 Arguments explaining China's fertilizer overuse suggest that the country’s soils are not particularly fertile and require extra nutrients.64 Recognizing that high fertilizer use is unsustainable and presents major environmental and human health challenges, the Chinese government announced policies to reduce chemical fertilizer use with mixed results. There remains scope for nitrate surpluses to be reduced by more than 50% and phosphate surpluses even by more than 75% without affecting the country’s food self-sufficiency.65
In the U.S., agriculture intensification over the past 40 years to boost productivity has led to the use of over 5.6 million tons of nitrogen through chemical fertilizers for maize annually, together with close to 1 million tons of nitrogen from manure. A significant amount of this fertilizer, together with eroded soil, washes into the country’s water bodies and coastal oceans, resulting in water pollution and damage to ecosystems. A major example is the dead zone in the Gulf of Mexico.66 Rains and melting snows wash nutrients such as nitrogen and phosphorus from farmland, sewage treatment plants and other sources along the Mississippi River, its tributaries and floodplains (an interconnected system). This system drains 41% of the U.S. and carries the nutrients into the Gulf of Mexico, causing the dead zone, an area roughly the size of Delaware. This has spawned blooming algae (known as eutrophication) that chokes oxygen and sunlight in the water, destroying biodiversity and impacting the Gulf’s tourism and seafood industry, which represents over 40% of U.S. seafood, second only to Alaska.
Climate change will negatively impact the production of cereals with regional variation, from China to the U.S. This calls for country-level analysis, especially for major producers and major importers that are pursuing import substitution pathways.
Cereals production and trade — understanding trends and climate risks
In this section, we discuss briefly general production and trade flows for cereals, highlighting recent trends that show relatively high levels of concentration in cereals production and exports among a handful of major producers. The trend in climate change elevates the risk of production and trade fluctuations, in turn threatening food security. Food trade plays a vital role in providing food security, especially for net food-importing countries. Two-thirds of the 152 developing countries are net food importers. This includes some Low-Income Food Deficit Countries (LIFDC). The WTO classifies all 46 Least Developed Countries (LDCs) as net food-importing developing countries. Some two-fifths of developing countries are net agriculture exporters, including 33 low-income countries. Therefore, there is scope for increased food trade within the Global South. Research demonstrates that global climate change will have an impact on production yields with food security and economic implications for agriculture-dependent regions and net food importers.67
Cereals are far and away the most traded agricultural commodity group, with exports reaching a record high of 492 million tons in 2020, an increase of 231 million tons compared to 2000. Three crops accounted for 90% of the total cereals export value in 2020, namely, wheat (38%, at USD45 billion), maize (31%, at USD37 billion) and rice (22%, at USD26 billion).68 Four crops account for half of global production volumes of primary crops in 2020, namely, sugar cane (20% of the total, with 1.9 billion tons), maize (12%, with 1.2 billion tons), rice and wheat (8%, with 0.8 billion tons each). Production is also dominated by a handful of countries (Figure 3).69
Figure 3: Net trade in cereals by region (million metric tons)
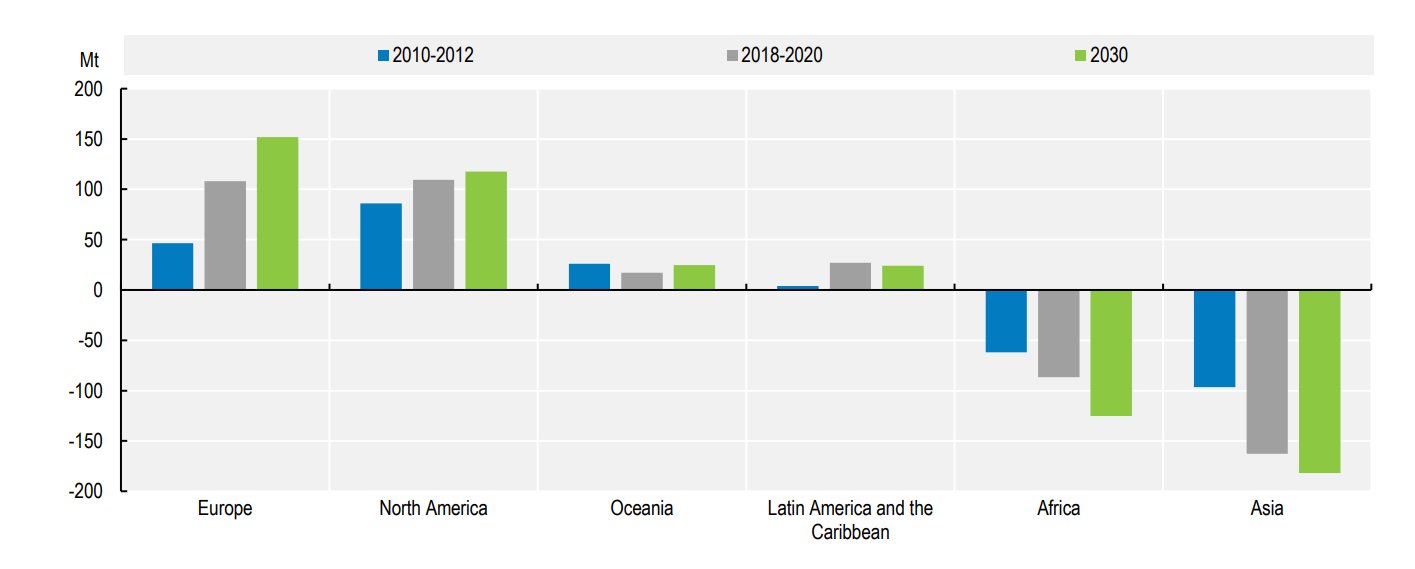
Note: Europe includes the Russia, Ukraine and Kazakhstan
Source: OECD/FAO. 2021. OECD-FAO Agricultural Outlook OECD Agriculture statistics (database) http://dx.doi.org/10.1787/agr-outl-data-en
Globally, about 17% of cereal production by volume is traded internationally. Shares for single commodities range from 9% for rice, 15% for maize and 25% for wheat.70 The share for total cereals trade is projected to grow to 18% by 2030 and reach 542 million metric tons (MT). Volumes of net cereal surplus and deficits exhibit regional patterns (Figure 4), which differ for individual commodities. For example, Asian countries boast a greater surplus in rice, while Latin America exports larger shares of maize but imports more wheat. Rice production across South and Southeast Asia (where 90% of the world’s rice is produced and consumed) was affected by warmer and drier conditions due to El Niño in the 2022/23 season. Previous El Niños have caused extreme weather, ranging from drought to floods, and a strong El Niño typically involves reduced rainfall, which is a major challenge for water-intensive rice cultivation. On the back of tight supply coupled with export bans imposed by India, the world’s largest rice producer, in July 2023, rice prices surged to their highest in almost 12 year.71 In terms of wheat, Russia overtook the European Union in 2016 as the leading wheat exporter and is expected to increase its output and account for 22% of global exports by 2030. Despite a declining share, the U.S. will remain the leading exporter of maize, followed by Brazil, Ukraine, Argentina and Russia. The EU, Australia and the Black Sea region are forecast to remain leading exporters of other coarse grains. India, Vietnam and Thailand are expected to remain the major global rice exporters, though the role of Cambodia and Myanmar in global rice trade is growing.72
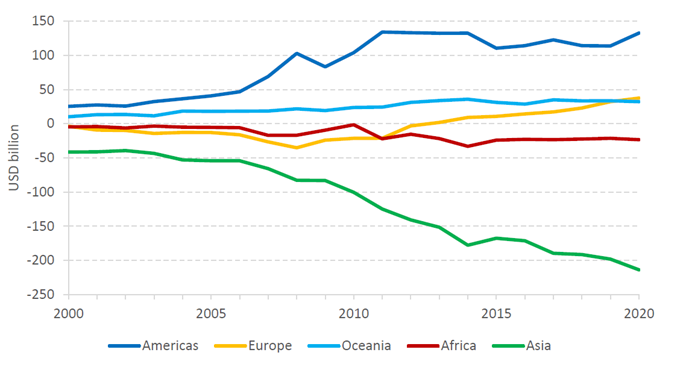
The value of global food exports increased 370% from about USD380 billion in 2000 to USD1.42 trillion in 2020.73 Two regions stand out (Figure 4). The Americas were the biggest net exporter, enjoying a surplus of USD121 billion in 2020, and Asia was the biggest net importer, with a USD197 billion food deficit in 2020.74 The U.S. became a net food importer for the first time in 2022 and again in 2023. Agriculture imports grew from a record USD194 billion in 2022 to USD198.3 billion in 2023, while exports grew from USD174.8 billion to USD195.8 in the same period.75 Due to shifting demand patterns, horticultural products account for the largest share of agriculture food imports at USD99.9 billion in FY 2023, with fruits, vegetables and tree nuts accounting for nearly 50% of this category. The rest is made up of other horticultural products, distilled spirits, wine and beer, followed by miscellaneous horticultural products, such as processed foods and ingredients, as well as essential oils, nursery and cut flowers. Mexico continued to expand as the leading supplier of agricultural products to the U.S., followed by Canada and the EU.
Oceania remained a net exporter of food from 2000-20, led by Australia and New Zealand, while Africa remained a net importer, although having significant potential for improved food self-sufficiency (Figure 4). Europe was a net food importer across most of the period but became a net exporter in 2013, overtaking Oceania in 2020. Both Africa and Asia’s food deficit grew between 2000 and 2020. Note that these values exclude intraregional trade. For example, Asia’s values only reflect Asian countries’ imports from and exports to countries outside the region.
Figure 4: Food net trade by region, USD billions (2000-20)
Source: FAO. Statistical Yearbook 2022.
Wheat was the most exported cereal (40%) in 2020, marginally in front of maize (39%) and rice (9%). In terms of growth, since 2000, maize, wheat and rice each accounted for 10% of the total exports in 2000. However, maize production has grown three times faster than wheat or rice in the last two decades, overtaking rice in 2001 to become the second most produced crop worldwide. Exports of maize are rising much faster (+134%) than those of rice (+95%) and wheat (+69%). On current trends, maize is expected to surpass wheat as the most traded cereal. Maize is grown in over 125 countries and is among the three major cultivated crops in 75 of those countries. It provides critical food security in developing regions, such as Africa, Asia and Latin America. It is a more versatile and multiuse crop than wheat or rice. In developed economies, maize is used mostly for livestock feed, industrial uses and biofuels. Rising global demand for maize is due to a rapidly growing maize feed market in high population countries, such as China and India, where rising incomes are spurring consumption of dairy and meat products, as well as increasing demand for maize as an industrial raw material for uses such as biofuel. For each of the main traded cereals, exports generally originate from a few major producing countries, while imports are more diversely spread. In 2020, the top three exporters accounted for sizeable shares of the total exports: 64% for maize, 57% for rice and 45% for wheat (Figure 5). By comparison, the top three importers accounted for 15-26% of the total imports for these commodities. The major producers generally also feature among the main exporters.
Figure 5: Major traded cereals, main importers and exporters (2020)
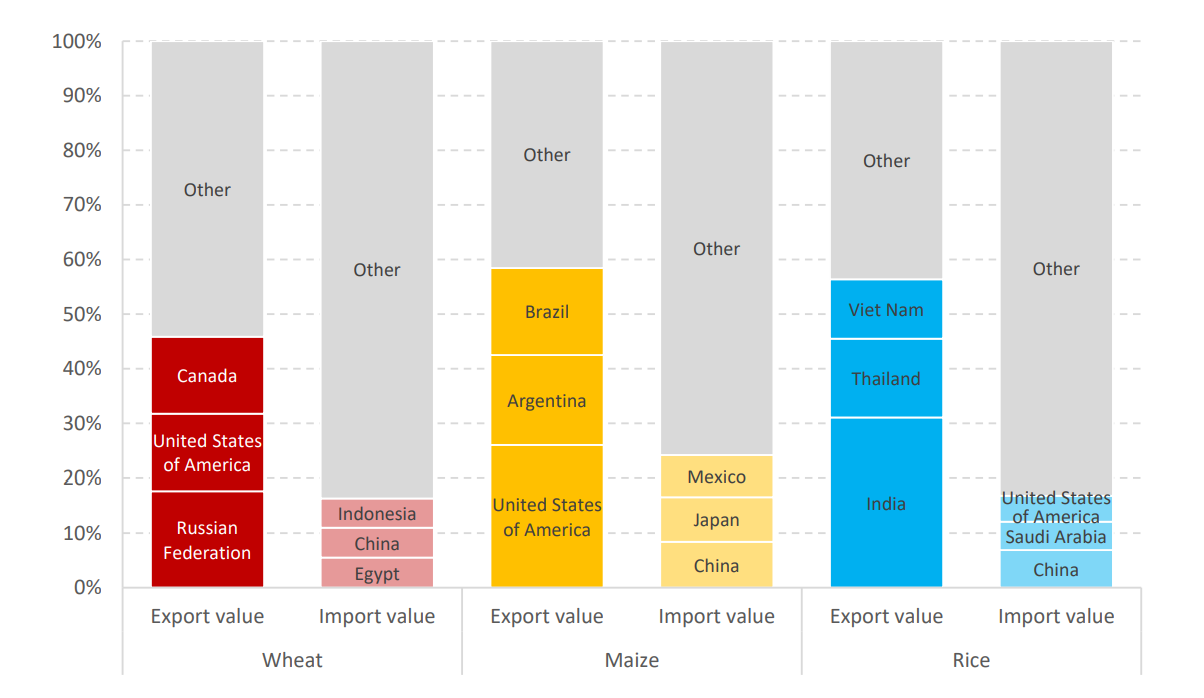
Source: FAO. Statistical Yearbook 2022 and FAOSTAT Analytical Brief 44 Trade of agricultural commodities 2000-20.
Over the next decade, cereal production is expected to increase by 336 MT, due to increases in major grain-producing countries.76 Over half of the global production increase in wheat will come from India, Russia and Ukraine, while for maize, the U.S., China and Brazil will account for more than half of the expected production increase. China is unique as both a major producer and consumer. China is focused on intensifying domestic production, as well as imports from countries including Brazil to meet domestic demand. Hence, China’s share of exports is small relative to its production. It is also the largest importer of rice, the country’s major staple. The U.S. exports maize to about 60 countries including the major markets of Mexico, Japan and China. In 2022 and 2023, these three markets accounted for 70% of U.S maize exports.77 While China had emerged as the largest market for U.S. maize in recent years, U.S. exports to China (the biggest global importer of maize) fell 70% from USD5.21 billion in 2022 to USD1.65 billion in 2023, as Chinese demand shifted to Brazil. With reduced exports to China, Mexico accounted for 40% of U.S. maize exports in 2023 with an increase in exports to Mexico from USD4.92 billion in 2022 to a record USD5.38 billion in 2023.78 Moreover, drought in the western plains of the U.S. and rising fertilizer and fuel prices all contributed to an increase in U.S. maize prices on the international market and led to a decrease in area planted in 2022 of 3.4 million acres compared to 2021. As weather-reduced crop yields impacted the international competitiveness of U.S. maize, new and competitive producers have emerged. Chinese buyers have cancelled orders from the U.S., while beginning to import maize from South Africa and Brazil, partly due to China’s food import diversification strategy in response to trade tensions with the U.S.
Mexico is a top 10 global producer of maize and a major global consumer of maize. It is forecast to produce about 27.4 million tons of maize in 2023-24, slightly down from 27.6 million tons in 2022-23.79 The country is home to about half the known genetic diversity for maize in the Americas, which is critical for future genetic improvement efforts to propagate new environmentally resilient varieties. Mexico imports about USD5 billon of U.S. maize annually and, despite legal challenges from the U.S. that IATP and others have strongly opposed, the country is moving away from the genetically modified variety (at least for human consumption), which is mostly imported from the U.S.80 Despite efforts to increase domestic production, Mexico’s maize imports are forecast to climb to 18 million tons for 2023-24, an increase of 5% from the previous year, due to increased demand from the starch and animal feed sectors.81 Thus, various factors are influencing maize production and trade flows, in addition to climate change.
In recent years, increased incidences of longer droughts have caused many farmers in areas of Mexico such as Puebla state to switch from maize and other cereals to alternatives that require less water, such as pistachio nuts, cactus or maguey (used to make alcoholic drinks). Mexico’s location between two oceans and on the Tropic of Cancer makes the country vulnerable to weather volatility. Some experts forecast that parts of Mexico such as the Tehuacán region in Puebla, with temperatures above the global average, will experience more severe effects of climate change compared to other countries. About 75% of Mexico’s soil is already too dry to cultivate crops, and the arid climate and topography limits agricultural production to 20.6 million hectares or 10.5% of the country’s territory.82 At least one-quarter of this land must be irrigated.
Again, looking broadly at the geographical distribution of major importers and exporters of food, the large population regions of Asia, Europe and North America are both large producers and importers of food. Despite having less than 10% of the world’s arable land, China accounts for 25% of global grain production. In 2020, China was the lead producer of over 30 crops, including wheat, rice, tomatoes and potatoes, and in recent times, meat production and consumption have begun to increase. This comes at an environmental cost, however, as China is also a leading user of fertilizer and source of emissions. The overuse of pesticides and fertilizers in China threatens not only the environment, but also public health. China has been making efforts to address overuse of fertilizers and pesticides to reduce emissions.83 China previously subsidized fertilizers considerably, but it has replaced these subsidies with measures to encourage the use of organic fertilizers produced from animal manure.
The above discussion highlights that there is both rising demand and production of food, especially with the expected rising populations and incomes in the global south. However, the trend in climate change elevates the risk of both production and trade volatility, which in turn threatens food security. With two-thirds of the 152 developing countries being net food importers, there is scope for increased food trade with the Global South to help address food security. Asia is the top importing region for cereals and a sizeable producer, while Africa is the most food insecure region and lagging in food trade, despite potential for improved production using an agroecological approach, better food distribution and access. Parts of Asia, Latin America and the Caribbean are also food insecure, although this is offset to some degree by strong production and exports in some countries within those regions.
Insights on specific cereals
Attempts at import substitution in wheat production threatened by climate trends
Despite more than 80 countries being engaged in wheat production, there remains some degree of concentration in global production and exports of wheat, in part because wheat production requires specific conditions for cultivation. To mitigate risk of supply disruptions and overdependence on imports, several wheat importing countries, for example, Ethiopia, have focused on import substitution through investments in domestic production, which are yielding results. Questions remain over the long-term sustainability of these approaches if the trends in climate change persist. To safeguard food security while remaining mindful of the need to build resilience to climate change, we advocate for increased support for dietary diversification that is suited to each country’s climatic conditions and nutritional needs.
Wheat plays a critical role in global food security. It provides one-fifth of food calories and protein to the world’s population and is a widely cultivated crop covering roughly 217 million hectares annually.84 The crop can be cultivated in various regions with heterogeneous weather, elevation or soil types. Global wheat production has increased steadily in the last decade from 732.2 million MT in 2014-1585 to 781 million MT in 2023.86 Globally, the processing industries that manufacture products such as flour, pasta, noodles and beverages have driven increased consumption of wheat across regions. The bulk of global wheat is directed towards food (546.5 million MT), feed (147.7 million MT) and industry, which includes processed food (24.2 million MT) and seed (38.1 million MT). The global wheat market is expected to grow from USD48 billion in 2023 to USD60.10 billion by 2028.87
The top 10 producing countries account for 80% of global wheat production, with production spread across East and Western Europe, Asia and the Americas. Consistent with trends over the last two decades, the five countries with the highest volumes of wheat production in 2023 were China (137 million MT), the EU (135 million MT),88 India (113 million MT), Russia (85 million MT) and the U.S. (47.19 million MT), together accounting for 65% of global production. These countries were followed by Canada, Australia, Pakistan, Ukraine, Turkey, Argentina, the United Kingdom, Kazakhstan and Iran, which together accounted for 25% of global wheat production. In terms of trade, countries exported about 209.3 million MT of wheat in 2023, with the top 10 exporting countries accounting for 194 million MT (Table 1).
Table 1: Leading World Exports of Wheat by Country 2023 (Million Metric Tons)
|
Rank
|
Country
|
% global share
|
Volume (Million MT)
|
|
1.
|
Russia |
23
|
48
|
|
2.
|
European Union |
18
|
38.5
|
|
3.
|
Canada |
12
|
24.5
|
|
4.
|
Australia |
10
|
21.5
|
|
5.
|
United States |
9
|
19.05
|
|
6.
|
Argentina |
6
|
12
|
|
7
|
Ukraine |
5
|
10.5
|
|
8.
|
Kazakhstan |
5
|
9.5
|
|
9.
|
Turkey |
4
|
7.5
|
|
10.
|
Brazil |
2
|
3.5
|
|
|
TOTAL |
94
|
194.5
|
Source: USDA Foreign Agricultural Service
Wheat is a key staple food crop in the Asia-Pacific region where consumption of wheat has increased for both human consumption and livestock feed. From 2021-22, China was the leading consumer of wheat (148.5 million MT or 18% of global production), followed by India (104.3 million MT or 17% of global production). To illustrate the level of production concentration, the top 10 wheat exporters account for 94% of global wheat exports supplying regions, such as the Middle East and North Africa, where wheat is the staple crop.
Wheat importation is distributed evenly among major developed and emerging middle-income economies and includes large population centers, as well as countries in the Middle East and North Africa (Table 2). The top 20 importing countries account for 64% of global wheat imports by volume. China is the leading global importer of wheat, followed by Egypt, each accounting for 6% of global wheat imports (12 million MT). Other major wheat importers include Indonesia, Turkey, Algeria, the EU, Morocco, Bangladesh, Brazil, etc.
Table 2: Leading World Imports of Wheat by Country 2023 (Million Metric Tons)
|
Rank
|
Country |
% global share
|
Volume (Million MT)
|
|
1.
|
China |
6
|
12
|
|
2.
|
Egypt |
6
|
12
|
|
3.
|
Indonesia |
5
|
10.5
|
|
4.
|
Turkey |
5
|
9.5
|
|
5.
|
Algeria |
4
|
8.7
|
|
6.
|
European Union |
3
|
7
|
|
7
|
Morocco |
3
|
7
|
|
8.
|
Philippines |
3
|
6.5
|
|
9.
|
Bangladesh |
3
|
5.8
|
|
10.
|
Brazil |
3
|
5.6
|
|
|
TOTAL |
41
|
84.6
|
Source: USDA Foreign Agricultural Service
The war in Ukraine disrupted Russian and Ukrainian production and exports, causing global prices to rise and creating food security challenges. Overall, high global food prices are expected to level and begin to drop in 2024.89 In 2020, some 25 countries, especially from Africa, were reliant on Russian and Ukraine for at least 50% of their wheat imports. For countries including Benin, Eritrea and Somalia, dependence was at 100% (Figure 6). In the ensuing years, some countries have diversified their import sources, while others have explored alternatives such as sticky rice in Laos or cassava in Uganda. Other countries have resorted to food protectionism through temporary bans on exports of cereals. Others still have sought to increase domestic production.
Figure 6: Countries with the highest dependency on wheat from Russia and Ukraine (2020)
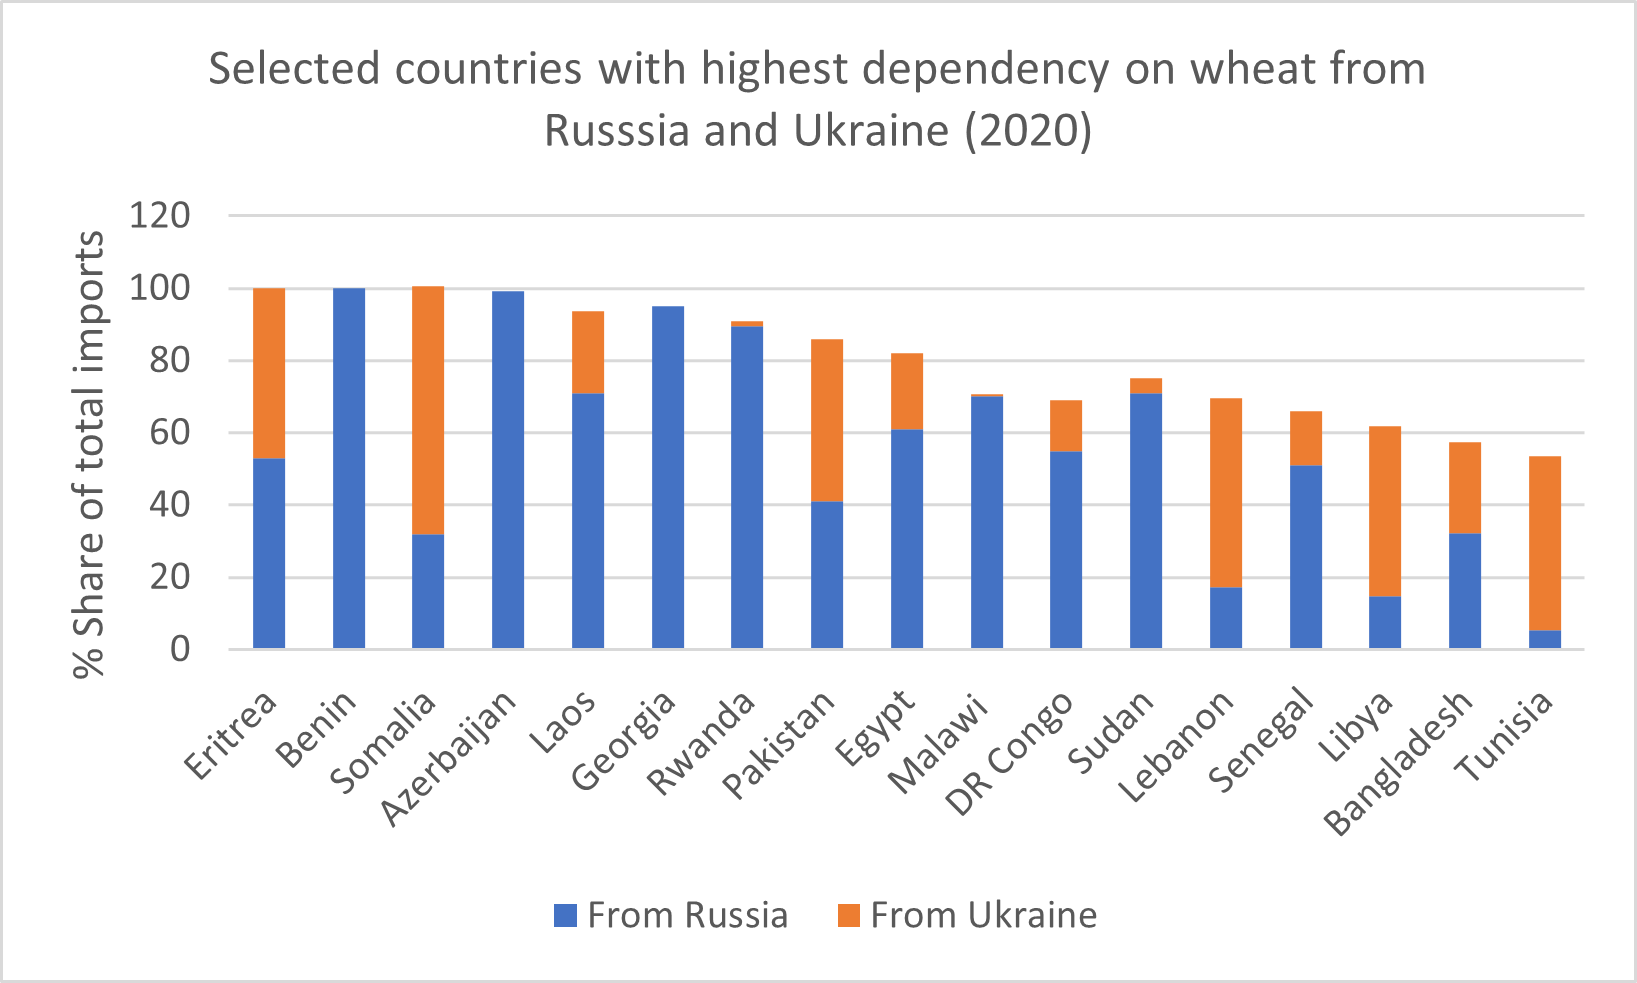
Source: UNCTAD. 2022. The Impact on Trade and Development of the War in Ukraine; U.N. Food and Agriculture Organization, 202290
Egypt, once a breadbasket of the Roman Empire, now imports about 40% of its food consumption in monetary terms, making it one of the most food-import-dependent countries in the world. The country is the world’s second largest importer of wheat (accounting for 6% of global imports) and has increased its own wheat yield by almost 38%, going from total production of 6.5 million tons in 2000 to almost 9 million metric tons in 2022.91 The increase was due to improved seeds, irrigation and agricultural mechanization. The wheat self-sufficiency rate has peaked at around 50%, with the balance met through imports and use of bread subsidies to contain prices. Notwithstanding these gains, at current population growth projections, Egypt’s demand for wheat is expected to triple by the end of the century. A climate study looking at wheat production in Egypt estimated that future wheat yield will decline largely due to climate change (rising temperatures), despite some yield improvements from new technologies.92 While the ongoing program to double irrigated land area by 2035 coupled with crop intensification could raise wheat production in the short term, these efforts would be insufficient after 2040, even with modest population growth. Moreover, Egypt faces water challenges as the increasing demand for high-quality water for irrigation in the last few decades has led to the use of poor-quality water for irrigation purposes in farmland. Demand for irrigation is expected to more than triple from 6 to 20 billion cubic meters to meet expanded wheat production, resulting in significant stress to water supply to meet irrigation demand and address challenges like salinization.ii
The 2024-25 season is the third consecutive year of drought conditions, the worst since 2003, and could force Algeria, Morocco and Tunisia to increase their wheat imports again to meet demand and bolster wheat stocks. North Africa is the largest wheat-importing region in the world. Wheat imports in 2023-24 reached the highest level in seven years due to a record-setting drought. Ethiopia, another large and populous country, is on a drive to achieve wheat production self-sufficiency. It is the second-largest wheat producer in Africa after Egypt. Against domestic wheat demand of about 7 million tons, the government is targeting self-sufficiency in wheat production and eventual exports. With 2 million hectares under crop, current production ranges between 4-5.52 million tons per year.93 With the introduction of a summer wheat irrigation strategy across Ethiopia, the government expects an additional 1.3 million hectares of summer wheat to be developed to supply regional partners, such as Kenya and Djibouti. Several challenges remain to be overcome. Wheat productivity remains comparatively low in Ethiopia in part due to climate change, climate variability and limited availability of adaptive strategies.
Revisiting the maize, biofuel and animal feed nexus to help address environmental and climate risks
Maize is widely grown globally. It is productive, with high yields compared to other crops, and has multiple uses. It has benefited from investments in research, breeding and promotion. According to data from the International Grains Council, total maize production for 2021-22 stood at 1,224.2 million MT. Maize exports amounted to 180.1 million MT. The bulk of maize went to animal feed (723.3 million MT), industrial uses (308.4 million MT) and food consumption (137.5 million MT). The U.S., China and Brazil account for 32%, 22% and 10%, respectively, of the global maize production (Table 3). Interruption to their production from climate change and other factors will have severe consequences for maize-importing nations. The U.S. is the world’s largest maize producer and exporter with production in 2021-22 at 353.84 million MT. With an average yield of 10.81 MT/hectare, according to the U.S. Department of Agriculture (USDA), maize yields have risen nearly three-fold between 1960 and 2022. Only a small fraction of U.S. maize directly feeds the nation’s people, and most maize for food is used to make high-fructose corn syrup. The majority of U.S. maize is used domestically as the key energy ingredient in livestock feed (38.7%), fuel ethanol production (40%), industrial uses such as sweeteners, starch, beverages/alcohol and seeds (0.2%), and exports (17.5%).94
Exports are an important source of demand for U.S. maize, and fluctuations in exports influence U.S. maize prices. Over the last decade, corn exports have ranged from 7% to as much as 20% of U.S. corn production. Mexico is the major export destination for U.S. maize, importing on average 21-32% of U.S. maize exports annually in recent years, followed by China, Japan, Canada and Colombia. Mexico’s consumption of maize more than doubled over the past decade with the U.S. supplying 85% of Mexico’s total maize imports up to the May 2022-23 marketing year, compared to 97% in the previous years. U.S. farmers plant an average of 90 million acres of maize each year (up from 60.2 million acres in 1983), with the bulk of the production concentrated in the Heartland region (from the Great Plains through Ohio). Iowa and Illinois generally account for about one-third of the U.S. crop.
Table 3: Maize 2023 World Production (Million MT)
Total production: 1,213,501,000 MT
|
Rank
|
Country
|
Production (million MT)
|
Global share %
|
|
1.
|
United States
|
383.2
|
32
|
|
2.
|
China
|
277
|
23
|
|
3.
|
Brazil
|
129
|
11
|
|
4.
|
European Union 27
|
59.7
|
5
|
|
5.
|
Argentina
|
54
|
4
|
|
6.
|
India
|
34.3
|
3
|
|
7.
|
Ukraine
|
27.5
|
2
|
|
8.
|
Mexico
|
27.4
|
2
|
|
9.
|
South Africa
|
16.8
|
1
|
|
10.
|
Russian Federation
|
14.6
|
1
|
|
11.
|
Canada
|
15.3
|
1
|
|
12.
|
Indonesia
|
13.1
|
1
|
|
13.
|
Nigeria
|
12.0
|
1
|
|
14.
|
Pakistan
|
10.5
|
1
|
|
15.
|
Ethiopia
|
10.4
|
1
|
|
16.
|
Philippines
|
8.4
|
1
|
|
17.
|
Turkey
|
8.2
|
1
|
|
18.
|
Egypt
|
7.6
|
1
|
|
19.
|
Serbia
|
7.0
|
1
|
|
20.
|
Tanzania, United
Republic of
|
5.9
|
0
|
|
21.
|
Thailand
|
5.5
|
0
|
|
22.
|
Bangladesh
|
4.95
|
0
|
|
23.
|
Paraguay
|
4.7
|
0
|
|
24.
|
Vietnam
|
4.1
|
0
|
|
25.
|
Malawi
|
3.5
|
0
|
|
26.
|
Mali
|
3.5
|
0
|
|
27.
|
Ghana
|
3.4
|
0
|
|
28.
|
Zambia
|
3.26
|
0
|
|
29.
|
Kenya
|
3.2
|
0
|
|
30.
|
Angola
|
2.8
|
0
|
Source: USDA Foreign Agricultural Service
Table 4: 2022/3 Top maize exporters and importers (Million MT)
Total Exports 196,189,000 MT
Total Imports 187,108,1000 MT
|
Rank
|
Country
|
Exports (Million MT)
|
% of Global export
|
Rank
|
Country
|
Imports (Million MT)
|
% of Global imports
|
|
1.
|
Brazil
|
55
|
28
|
1.
|
European Union 27
|
24
|
13
|
|
2.
|
United States
|
52
|
27
|
2.
|
China
|
23
|
12
|
|
3.
|
Argentina
|
40
|
21
|
3.
|
Mexico
|
18
|
10
|
|
4.
|
Ukraine
|
19
|
10
|
4.
|
Japan
|
15
|
8
|
|
5.
|
Russia
|
4.2
|
2
|
5.
|
South Korea
|
11
|
6
|
|
6.
|
European Union 27
|
4.1
|
2
|
6.
|
Vietnam
|
10.5
|
6
|
|
7.
|
India
|
3.6
|
2
|
7.
|
Iran
|
8.7
|
5
|
|
8.
|
South Africa
|
3.4
|
2
|
8.
|
Egypt
|
7.5
|
4
|
|
9.
|
Paraguay
|
3.0
|
2
|
9.
|
Colombia
|
6.5
|
3
|
|
10.
|
Serbia
|
2.5
|
1
|
10.
|
Saudi Arabia
|
4.7
|
3
|
|
11.
|
Myanmar
|
2.2
|
1
|
11.
|
Taiwan
|
4.6
|
2
|
|
12.
|
Canada
|
1.8
|
1
|
12.
|
Algeria
|
4.4
|
2
|
|
13.
|
Cambodia
|
0.5
|
0
|
13.
|
Malaysia
|
3.85
|
2
|
|
14.
|
Turkey
|
0.5
|
0
|
14.
|
Peru
|
3.6
|
2
|
|
15.
|
Vietnam
|
0.5
|
0
|
15.
|
Morocco
|
2.8
|
1
|
|
16.
|
Pakistan
|
0.4
|
0
|
16.
|
United Kingdom
|
2.4
|
1
|
|
17.
|
Tanzania
|
0.4
|
0
|
17.
|
Chile
|
2.35
|
1
|
|
18.
|
Zambia
|
0.4
|
0
|
18.
|
Bangladesh
|
2.2
|
1
|
|
19.
|
Mexico
|
0.3
|
0
|
19.
|
Canada
|
2.2
|
1
|
|
20.
|
Moldova
|
0.3
|
0
|
20.
|
Israel
|
1.8
|
1
|
|
21.
|
Laos
|
0.150
|
0
|
21.
|
Thailand
|
1.8
|
1
|
|
22.
|
Malawi
|
0.100
|
0
|
22.
|
Turkey
|
1.8
|
1
|
|
23.
|
Thailand
|
0.100
|
0
|
23.
|
Guatemala
|
1.6
|
1
|
|
24.
|
Uganda
|
0.100
|
0
|
24.
|
Dominican Republic
|
1.5
|
1
|
|
25.
|
United Kingdom
|
0.100
|
0
|
25.
|
Brazil
|
1.2
|
1
|
|
26.
|
Kazakhstan
|
0.075
|
0
|
26.
|
Indonesia
|
1.0
|
1
|
|
27.
|
Australia
|
0.060
|
0
|
27.
|
Costa Rica
|
0.9
|
0
|
|
28.
|
Cote d’Ivoire
|
0.060
|
0
|
28.
|
Honduras
|
0.85
|
0
|
|
29.
|
Nigeria
|
0.050
|
0
|
29.
|
Iraq
|
0.8
|
0
|
|
30.
|
Bolivia
|
0.025
|
0
|
30.
|
Philippines
|
0.8
|
0
|
Source: USDA Foreign Agricultural Service
In the U.S., a significant share of growth in maize production is attributed to ethanol production, as well as domestic demand for livestock feed and higher prices. Maize production has expanded to non-traditional growing areas, especially in the north, using short-season hybrid seeds. However, the outlook for U.S. maize exports is bleak. U.S. maize export dominance is slowly receding in an increasingly competitive global marketplace for maize. While Mexico remains the largest market for U.S. maize, that country is also attempting to lessen its dependence on imports. Chinese imports of U.S. maize were rising, but with recent trade tensions, China has reduced its demand from the U.S. by 48% (through mid-June 2023) from the previous year while ramping up imports from Brazil, which are cheaper than U.S. Gulf Coast port prices by about USD30 per MT. China is also exploring ways to improve self-sufficiency, and since 2012, it has produced more maize than rice. In 2021, China produced 43% maize and 34% rice, with a large part of demand for maize from domestic animal feed and ethanol fuel.
Along with other critics, we argue that the increasing focus on animal feed and biofuels makes the maize production system inefficient at feeding people within some of the large producer countries. Even where maize is fed to animals to produce meat and dairy products, there is a major loss of calories and protein along the value chain due to low conversion rates from grain to meat and dairy. Governments should stop increasing demand artificially for biofuels, which would lower demand for grain and lessen commodity price pressure.95 Moreover, reducing consumption of maize-fed meat, or shifting toward more efficient dairy, poultry, pork and grass-fed beef systems, would enable the food system to deliver more food per bushel of maize and a more diverse and nutritious diet compared to the existing system. It would also reduce the negative impact on the climate and environment. U.S. maize, for example, uses more land than any other crop, covering roughly 97 million acres. It consumes significant amounts of freshwater resources and involves massive use of chemical fertilizer, such as nitrogen, as well nitrogen from manure. Much of this fertilizer washes into the nation’s water bodies causing pollution and damaging ecosystems.
The case of rice illustrates the challenges of climate, concentrated production and volatility in food trade
Over half of the global population depends on rice as a major part of their diet, including in much of Asia, Latin America, Africa and the Caribbean. With a record 789 million MT produced globally in 2021, rice is the world’s third-most produced agricultural crop behind sugarcane and maize. Just 10 countries account for nearly 84% of global rice production (Figure 8), meaning that most rice-consuming countries must rely on imports to meet domestic demand. China and India are the top two producers, accounting for more than half of the global total. All the top 10 producers are located in Asia, except for Brazil.
In September 2023, USDA reported that global rice export prices had peaked to the highest levels in 15 years due to rice export restrictions imposed by India (on non-Basmati white rice, covering 75-80% of Indian rice exports) in July 2023 (including a 20% export duty on parboiled rice).96 Prices began rising in 2022, following floods in Pakistan — the world’s fourth-largest rice exporter (Table 5) — which impacted global supply. Rice is a water-intensive crop, and an earlier-than-usual El Niño in the 2023 season was forecast to reduce rice production across Asia, where 90% of the world’s rice is grown and consumed. The road to normalization of rice exports from India will be long, due to policy uncertainty and firmness in local prices despite the trade restrictions. There are concerns that other major rice producers and exporters, such as Thailand and Vietnam, the second and third-largest rice exporters accounting for 16% and 15% of global market share, respectively, could emulate India and impose similar bans on rice exports, which would further drive up world rice prices.[97] Thailand has expressed concerns about drought conditions in 2024, while some growing regions in India and China — the world’s largest rice producer and consumer — might be at risk of drought. Thailand and Vietnam have sought to take advantage of the market situation to increase supplies to countries like the Philippines (the world’s second-largest importer of rice), Indonesia (sixth-largest importer) and Japan. On the other hand, experts are concerned that when the ban is lifted, the global market could be flooded with Indian rice, should there be a major market overcorrection.
Table 5: Leading producers of milled rice 2022/2023 (1,000 MT)
|
Rice 2022 World Exports: 54,303 (1,000 MT)
|
| Rank 2023 |
Country |
2022 |
2023 |
% World Production 2023 |
|
|
World TOTAL |
513,563
|
518,084
|
|
|
1
|
China |
145,946
|
149,000
|
29
|
|
2
|
India |
136,000
|
132,000
|
25
|
|
3
|
Bangladesh |
36,350
|
36,400
|
7
|
|
4
|
Indonesia |
34,000
|
34,450
|
7
|
|
5
|
Vietnam |
27,000
|
27,000
|
5
|
|
6
|
Thailand |
20,909
|
19,500
|
4
|
|
7
|
Philippines |
12,631
|
12,600
|
2
|
|
8
|
Burma |
11,800
|
12,000
|
2
|
|
9
|
Pakistan |
5,500
|
9,000
|
1
|
|
10
|
Japan |
7,480
|
7,450
|
1
|
|
11
|
United States |
5,092
|
7,014
|
1
|
|
12
|
Brazil |
7,004
|
6,800
|
2
|
|
13
|
Cambodia |
5,933
|
6,000
|
1
|
|
14
|
Nigeria |
5,355
|
5,229
|
1
|
|
15
|
Egypt |
3,600
|
3,780
|
1
|
|
16
|
Nepal |
3,654
|
3,654
|
1
|
|
17
|
South Korea |
3,764
|
3,610
|
1
|
|
18
|
Sri Lanka |
2,783
|
3,060
|
1
|
|
19
|
Madagascar |
2,816
|
2,816
|
1
|
|
20
|
Peru |
2,484
|
2,500
|
0
|
Source: USDA Foreign Agriculture Service
Table 6: World Rice Imports and Exports 2022 (1,000 MT)
|
Rice 2022 World Exports: 54,303 (1,000 MT)
|
World Rice Imports 2022: 53,665 (1,000 MT)
|
|
Rank
|
Country |
% World Exports (%)
|
Imports
(1,000 MT)
|
Rank
|
Country
|
% of World Imports (%)
|
Imports
(1,000 MT)
|
|
1
|
India |
39
|
21,000
|
1
|
China
|
8
|
4,384
|
|
2
|
Thailand |
16
|
8,500
|
2
|
Philippines
|
7
|
3,750
|
|
3
|
Vietnam |
15
|
8,000
|
3
|
European Union
|
5
|
2,500
|
|
4
|
Pakistan |
7
|
3,700
|
4
|
Iraq
|
4
|
2,100
|
|
5
|
United States |
4
|
2,042
|
5
|
Nigeria
|
4
|
2,100
|
|
6
|
Cambodia |
3
|
1,800
|
6
|
Indonesia
|
4
|
2,000
|
|
7
|
China |
3
|
1,736
|
7
|
Vietnam
|
3
|
1,500
|
|
8
|
Burma |
3
|
1,400
|
8
|
Cote d'Ivoire
|
3
|
1,400
|
|
9
|
Brazil |
2
|
1,200
|
9
|
Saudi Arabia
|
2
|
1,300
|
|
10
|
Uruguay |
2
|
925
|
10
|
Senegal
|
2
|
1,300
|
|
11
|
Paraguay |
2
|
880
|
11
|
Bangladesh
|
2
|
1,275
|
|
12
|
Argentina |
1
|
400
|
12
|
United States
|
2
|
1,267
|
|
13
|
European Union |
1
|
400
|
13
|
Malaysia
|
2
|
1,150
|
|
14
|
Guyana |
1
|
358
|
14
|
Iran
|
2
|
1,100
|
|
15
|
Australia |
1
|
275
|
15
|
South Africa
|
2
|
1,087
|
|
16
|
Turkey |
0
|
230
|
16
|
Kenya
|
2
|
1,000
|
|
17
|
Taiwan |
0
|
150
|
17
|
Guinea
|
2
|
950
|
|
18
|
South Africa |
0
|
149
|
18
|
Brazil
|
2
|
900
|
|
19
|
Japan |
0
|
120
|
19
|
Mozambique
|
2
|
810
|
|
20
|
Suriname |
0
|
110
|
20
|
Mexico
|
1
|
800
|
Source: USDA Foreign Agriculture Service
In conclusion, rice feeds over half the world’s population. Global rice demand has increased steadily over the years and is expected to rise from 520 million MT in 2021-22 to 555 million ton in 2035. Recent estimates suggest that we are facing a major shortage of rice with rising prices that threatens food security for many rice-importing developing countries.98 Yields are also in decline due to climate-related floods, drought and severe weather. Since rice also contributes significantly to greenhouse gas emissions, a transition to more sustainable and decarbonized production and cultivation methods is needed urgently.
This supply concentration in production and exports presents risks of price volatility and supply disruptions. Concerns about declining production of certain crops or least supply volatility due to climate impacts are well founded, especially for the cultivation of wheat (which in some regions must relocate to higher and cooler elevation due to the changing climate) and rice (which can only be grown in certain locations, requires more water than other crops and is often grown in flooded fields). The precise nature and extent of the climate-related change in cereals production is evolving as conditions change and new climate science data emerges.
Conclusion: Mitigating climate risk in cereals production and trade
Climate change poses serious risks to the production and trade of cereals. In this paper, we highlighted significant climate trends that are impacting cereal production in the major producing countries and regions and the threats faced by importing countries. While a diversity of countries import cereals, a handful of major producers dominate the production and export of cereals. In 2022, the top three exporting countries accounted for 64% for maize volumes, 57% for rice and 45% for wheat.99
To address the challenge of food security, rather than resorting to agriculture expansion and more intensive irrigation and chemical fertilizer use, IATP has long argued for a more environmentally sustainable approach to food production which avoids over-production, dumping and food waste. A transition to agroecological approaches, especially those focused primarily on small-scale agriculture, would have benefits for the climate, food security and rural livelihoods.100 In the U.S., for example, the USDA has documented a trend of increasing consolidation in the U.S. farm sector with a shift in agricultural production to large-scale operations above 500 acres.101 The USDA Economic Research Service (ERS) attributes this structural change to productivity advantages enjoyed by larger operations in the American Heartland region.102 Instead of consolidation and intensification, we call for a transition to an agroecology-based approach, which addresses the problems of the food system from farm to fork, as well as the impacts on the natural resource base on which food systems depend, both now and in the future. Agroecology emphasizes the welfare of farmers, consumers and the environment. Unlike the existing industrialized agriculture system that is extractive, exploitative and leads to both high emissions and environmental degradation, agroecology recognizes the interdependence of living systems and emphasizes balance and diversity. Studies show that agroecology can promote climate change mitigation and adaptation without compromising food security.103 In one study, crop yields employing agroecology were higher for 63% of cases reporting yields. About 70% of cases exhibited crop diversity, income diversity, net income gains, reduced income variability and reduced pest infestation, indicators of adaptive capacity.104
To mitigate climate risk in cereal production and trade, we argue for developing more resilient food systems, increasing domestic and regional cereal production to address food security for net food importers. Major food importers, such as China, Egypt, Ethiopia and Nigeria, have made strides in strengthening their domestic food production.105 More localized food production and regional sourcing creates shorter value chains and reduces some of the risks of supply disruption. It also reduces greenhouse gas emissions related to transportation and preservation of food over long distances. Ultimately, addressing climate risk involves rethinking food production systems, putting climate change at the heart of food systems and supporting dietary diversity.106
Footnotes
i. Note in this report we refer to both “tons/tonnes” and “metric tons” (MT) depending on the reporting source given that different countries and international organizations use different units of mass for measurement. A metric tonne (MT) is the more widely used term worldwide. Guidance from the FAO states, “In general, use ‘tonnes’ (equal to 1000 kg), not ‘tons’ (2,240 lbs or approximately 1,016 kg). A ‘tonne’ is sometimes referred to in the United States of America as a ‘metric ton’, but always use the word ‘tonn.’” Source: FAO Terminology Portal, https://www.fao.org/faoterm/viewentry/en/?entryId=42157 (Accessed July 30, 2024).
ii. Globally, roughly 400 million hectares of soil are classified as saline. Salinization is a major problem associated with irrigation. As deposits of salts build up in the soil, they can reach levels that are harmful to crops. Moreover, the salts can make ground water, which may be in use for drinking, saltier and unsuitable for drinking. Soil salinization can also lead to a decrease in soil fertility, reducing plant growth and productivity and reduced food security, especially in arid and semiarid zones like Egypt. Progressive salinization is one of the major causes of soil degradation in Europe, the Near East and North Africa, bringing heightened pressure on conventional farming based on freshwater resources. See Saline Agriculture for Adaptation (SALAD). 2022. Salinity problems in Egypt. Available online at https://www.saline-agriculture.com/
Downloads
Download a PDF of the report.
Discover more
- Register for our September 24, 2024 webinar, "Climate change risks for import-dependent and major food-producing countries" to dig deeper into the report's findings in a conversation with academic experts and practitioners.
- Read a short article about the report.
Endnotes
1 R.K. Sharma, S. Kumar, K. Vatta, et al., “Impact of recent climate change on corn, rice, and wheat in southeastern USA,” Scientific Reports 12, no. 16928 (2022).
2 FAOSTAT, “Trade of agricultural commodities 2000–2020.” Analytical Brief 44 (2022), https://www.fao.org/3/cb9928en/cb9928en.pdf (Accessed June 30, 2024).
3 “Genetic Causes for Declining Protein in Cultivated Corn,” Genetic Engineering & Biotechnology News, November 17, 2022, https://www.genengnews.com/ (Accessed May 30, 2024).
4 Jikun Huang, Martin Piñeiro, Valeria Piñeiro, Kym Anderson, Nelson Illescas, David Laborde and Laura Wellesley, “Global food security and market stability: The role and concerns of large net food importers and exporters.” T20 Argentina: Food Security and Sustainable Development Task Force Brief, 2021, https://www.g20-insights.org/policy_briefs/global-food-security-and-market-stability-the-role-and-concerns-of-large-net-food-importers-and-exporters/ (Accessed May 30, 2024).
5 Tim G. Benton, Carling Bieg, Helen Harwatt, Roshan Pudasaini and Laura Wellesley, “Food system impacts on biodiversity loss: Three levers for food system transformation in support of nature,” https://www.chathamhouse.org/sites/default/files/2021-02/2021-02-03-food-system-biodiversity-loss-benton-et-al_0.pdf (Accessed June 30, 2024).
6 FAO, “The future of food and agriculture – Alternative pathways to 2050,” Rome, 2018, https://www.fao.org/3/CA1553EN/ca1553en.pdf (Accessed June 30, 2024).
7 International Energy Agency and International Renewable Energy Agency, “Breakthrough Agenda Report 2022,” https://www.iea.org/reports/breakthrough-agenda-report-2022 (Accessed May 30, 2024); Mukherji, Aditi; Arndt, Claudia; Arango, Jacobo; Flintan, Fiona E.; Derera, John; Francesconi, Wendy; Jones, Sarah K.; Loboguerrero Rodriguez, Ana María; Merrey, Douglas J.; Mockshell, Jonathan Yaw; Quintero, Marcela; Mulat, Daniel Girma; Ringler, Claudia; Ronchi, Loraine; Sanchez, Manuel Ernesto Narjes; Sapkota, Tek Bahadur and Thilsted, Shakuntala H, “Achieving agricultural breakthrough: A deep dive into seven technological areas,” CGIAR, Montpellier, France, 2023, https://www.cgiar.org/research/publication/agricultural-breakthrough/ (Accessed May 30, 2024).
8 In this paper we use the term to also include corn, as both terms reference the same cereal grain.
9 World Meteorological Organization, “WMO confirms that 2023 smashes global temperature record,” January 12, 2024, https://wmo.int/media/news/wmo-confirms-2023-smashes-global-temperature-record. See also Roxana Bardan, “NASA Analysis Confirms 2023 as Warmest Year on Record,” January 12, 2024, https://www.nasa.gov/news-release/nasa-analysis-confirms-2023-as-warmest-year-on-record/ (Accessed May 30, 2024).
10 The brief relies on various data sources that include FAOSTAT, International Grains Council, the International Food Policy Research Institute (IFPRI) and national data sources such as the U.S. Department of Agriculture and climate model simulations from the National Aeronautics and Space Administration (NASA). It also makes use of information drawn from journal articles, reports by international development agencies like the U.N. Intergovernmental Panel on Climate Change (IPCC, 2023) and other secondary literature. The brief was inspired and informed by a draft manuscript Kushank Bajaj et al., “Risk of National Food supply disruptions from climate change: Availability and affordability trade-offs (forthcoming),” 2023. This brief contributes to the growing body of literature looking at the impact of climate on food production, nutrition and food security and the nexus with trade. See, for example, reports submitted for the General Assembly 2023 of the European Geosciences Union (EGU), Vienna, April 23–28, 2023.
11 See IATP. “Agroecological Transitions: Why agroecology?” https://www.iatp.org/agroecological-transitions (Accessed May 30, 2024).
12 FAO, “World Food and Agriculture – Statistical Yearbook 2021,” Rome, 2021, https://doi.org/10.4060/cb4477en (Accessed May 30, 2024). See also Olaf Erenstein, Moti Jaleta, Khondoker Abdul Mottaleb, Kai Sonder, Jason Donovan and Hans-Joachim Braun, “Global Trends in Wheat Production, Consumption and Trade,” in Matthew P. Reynolds Hans-Joachim Braun (eds), “Wheat Improvement: Food Security in a Changing Climate,” Springer, Cham, 2022, https://link.springer.com/chapter/10.1007/978-3-030-90673-3_4 (Accessed May 30, 2024). Ten global crops provide 83% of all harvested food calories and account for 63% of global crop harvested areas: maize, wheat, rice, soybean, oil palm, sugar cane, barley, sorghum, rapeseed and cassava.
13 FAO, “World Food and Agriculture – Statistical Yearbook 2021,” Rome, 2021. https://doi.org/10.4060/cb4477en (Accessed May 30, 2024).
14 Deepak K. Ray, Lindsey L. Sloat, Andrea S. Garcia, Kyle F. Davis, Tariq Ali and Wei Xie, “Crop harvests for direct food use insufficient to meet the UN’s food security goal,” Nature Food 3 (2022): 367–374, https://doi.org/10.1038/s43016-022-00504-z (Accessed May 30, 2024).
15 FAO, IFAD, UNICEF, WFP and WHO, “The State of Food Security and Nutrition in the World 2022. Repurposing food and agricultural policies to make healthy diets more affordable,” Rome, FAO, 2022, https://doi.org/10.4060/cc0639en (Accessed May 30, 2024).
16 U.N. Environment Programme, “How to feed 10 billion people,” July 13, 2020, https://www.unep.org/news-and-stories/story/how-feed-10-billion-people (Accessed May 30, 2024).
17 Food and Agriculture Organization of the United Nations, “Seeking end to loss and waste of food along production chain,” December 10, 2013, https://www.fao.org/in-action/seeking-end-to-loss-and-waste-of-food-along-production-chain/en/ (Accessed May 30, 2024).
18 IATP, “Food Waste,” September 9, 2008, https://www.iatp.org/blog/2008/09/food-waste (Accessed May 30, 2024).
19 FAO, IFAD, UNICEF, WFP and WHO, “The State of Food Security and Nutrition in the World 2022: Repurposing food and agricultural policies to make healthy diets more affordable,” Rome, FAO 2022, https://doi.org/10.4060/cc0639en (Accessed May 30, 2024).
20 Sabri Bromage, Yiwen Zhang, Michelle D Holmes, Sonia E Sachs, Jessica Fanzo, Roseline Remans, Jeffrey D Sachs, Carolina Batis, Shilpa N Bhupathiraju, Teresa T Fung, Yanping Li, Meir J Stampfer, Megan Deitchler, Walter C Willett, Wafaie W Fawzi, “The Global Diet Quality Score Is Inversely Associated with Nutrient Inadequacy, Low Midupper Arm Circumference, and Anemia in Rural Adults in Ten Sub-Saharan African Countries,” The Journal of Nutrition 151, Issue Supplement 2 (October 2021): 119S–129, https://pubmed.ncbi.nlm.nih.gov/34689197/ (Accessed May 30, 2024).
21 Ramandeep Kumar Sharma, Sunny Kumar, Kamal Vatta, Raju Bheemanahalli, Jagmandeep Dhillon and Krishna N. Reddy, “Impact of recent climate change on maize, rice, and wheat in southeastern USA,” Sci Rep 12 (2022): 16928, https://doi.org/10.1038/s41598-022-21454-3 (Accessed May 30, 2024)
22 Dhurba Neupane, Pramila Adhikari, Dwarika Bhattarai, Birendra Rana, Zeeshan Ahmed, Umanath Sharma and Debraj Adhikari, “Does climate change affect the yield of the top three cereals and food security in the world?” Earth 3(1) (2022): 45–71, https://www.mdpi.com/ (Accessed May 30, 2024)
23 FAO, “The future of food and agriculture – Drivers and triggers for transformation. The Future of Food and Agriculture, no. 3,” Rome, 2022, https://doi.org/10.4060/cc0959en (Accessed May 30, 2024).
24 Union of Concerned Scientists, “Climate Change and Agriculture: A Perfect Storm in Farm Country,” March 20, 2019. https://www.ucsusa.org/resources/climate-change-and-agriculture
25 Johan Swinnen, Channing Arndt and Rob Vos, “Climate change and food systems: Transforming food systems for adaptation, mitigation, and resilience,” in “2022 Global Food Policy Report: Climate Change and Food Systems,” pp. 6-15. International Food Policy Research Institute (IFPRI), 2022, https://doi.org/10.2499/9780896294257_01 (Accessed May 30, 2024).
26 The annual Global Report on Food Crises is produced by the Food Security Information Network (FSIN) and launched by the Global Network Against Food Crises (GNAFC), an international group of the United Nations, the European Union, governmental and non-governmental agencies, collaborating to address the food crises. See Food Security Information Network and Global Network Against Food Crises, “Global Report on Food Crises 2023,” Rome, 2023, https://www.fsinplatform.org/global-report-food-crises-2023 (Accessed May 30, 2024).
27 Johanna Hedlund, Henrik Carlsen, Simon Croft, Chris West, Örjan Bodin, Emilie Stokeld, Jonas Jägermeyr and Christoph Müller, “Impacts of climate change on global food trade networks,” Environmental Research Letters 17, no. 12 (2022), https://iopscience.iop.org/article/10.1088/1748-9326/aca68b (Accessed May 30, 2024).
28 Jonas Jägermeyr, Christoph Müller, Alex C. Ruane, Joshua Elliott, Juraj Balkovic, Oscar Castillo, Babacar Faye, Ian Foster, Christian Folberth, James A. Franke, Kathrin Fuchs, Jose R. Guarin, Jens Heinke, Gerrit Hoogenboom, Toshichika Iizumi, Atul K. Jain, David Kelly, Nikolay Khabarov, Stefan Lange, Tzu-Shun Lin, Wenfeng Liu, Oleksandr Mialyk, Sara Minoli, Elisabeth J. Moyer, Masashi Okada, Meridel Phillips, Cheryl Porter, Sam S. Rabin, Clemens Scheer, Julia M. Schneider, Joep F. Schyns, Rastislav Skalsky, Andrew Smerald, Tommaso Stella, Haynes Stephens, Heidi Webber, Florian Zabel and Cynthia Rosenzweig, “Climate impacts on global agriculture emerge earlier in new generation of climate and crop models,” Nat Food 2 (2021): 873–885, https://www.nature.com/articles/s43016-021-00400-y#citeas (Accessed May 30, 2024)
29 Ibid.
30 Ibid.
31 Y.-H. Luhand and Y.C. Chang, “Effect of Climate Change on Staple Food Production: Empirical Evidence from a Structural Ricardian Analysis.” Agronomy 11, no 2. (2021): 369, https://doi.org/10.3390/agronomy11020369
32 Jonas Jägermeyr et al., “Climate impacts on global agriculture emerge earlier in new generation of climate and crop models,” Nat Food 2 (2021): 873–885, https://www.nature.com/articles/s43016-021-00400-y#citeas (Accessed May 30, 2024)
33 Johanna Hedlund, Henrik Carlsen, Simon Croft, Chris West, Örjan Bodin, Emilie Stokeld, Jonas Jägermeyr and Christoph Müller, “Impacts of climate change on global food trade networks,” Environmental Research Letters 17, no. 12, https://iopscience.iop.org/article/10.1088/1748-9326/aca68b (Accessed May 30, 2024).
34 Robert Mendelsohn, Ariel Dinar and Larry Williams, “The distributional impact of climate change on rich and poor countries,” Environmental and Development Economics 11 (2006): 159–178; Junguo Liu, Christian Folberth, Hong Yang, Johan Röckström, Karim Abbaspour and Alexander J B Zehnder, “A global and spatially explicit assessment of climate change impacts on crop production and consumptive water use,” PLoS ONE 8 (2013): e57750, https://pubmed.ncbi.nlm.nih.gov/23460901/; Robert O. Mendelsohn and Emanuele Massetti, “The use of cross-sectional analysis to measure climate impacts on agriculture: Theory and evidence,” Rev. Environ. Econ. Policy 11 (2017): 280–298, https://www.journals.uchicago.edu/doi/10.1093/reep/rex017 (Accessed May 30, 2024).
35 Yir-Hueih Luh and Chang Yun-Cih, “Effect of Climate Change on Staple Food Production: Empirical Evidence from a Structural Ricardian Analysis,” Agronomy 11, no. 2 (2021): 369, https://doi.org/10.3390/agronomy11020369 (Accessed May 30, 2024).
36 Ramandeep Kumar Sharma, Sunny Kumar, Kamal Vatta, Raju Bheemanahalli, Jagmandeep Dhillon and Krishna N. Reddy, “Impact of recent climate change on corn, rice, and wheat in southeastern USA,” Sci Rep 12 (2022): 16928, https://www.nature.com/articles/s41598-022-21454-3 (Accessed June 30, 2024)
37 Ibid.
38 Beck et al. (2018) use the Köppen-Geiger climate classification as a basis for present-day (1980–2016) scenarios and for projected future conditions (2071–2100) under climate change derived from 32 climate model projections. See Hylke E. Beck, Niklaus E. Zimmermann, Tim R. McVicar, Noemi Vergopolan, Alexis Berg and Eric F. Wood, “Present and future Köppen-Geiger climate classification maps at 1-km resolution,” Sci Data 5 (2018): 180214, https://doi.org/10.1038/sdata.2018.214 (Accessed May 30, 2024)
39 Andrew G. O. Malone, “Quantifying Who Will Be Affected by Shifting Climate Zones,” Geographies 3, no. 3 (2023): 477-498, https://doi.org/10.3390/geographies3030025 (Accessed May 30, 2024).
40 Ibid. See further Robert V. Rohli, T. Andrew Joyner, Stephen J. Reynolds, Cynthia Shaw and Javier R. Vázquez, “Globally extended Köppen–Geiger climate classification and temporal shifts in terrestrial climatic types,” Phys. Geography 3 (2015), 142–157, https://doi.org/10.1080/02723646.2015.1016382 (Accessed June 30, 2024).
41 USDA Economic Research Service, “Feed Grains Sector at a Glance,” 2023, https://www.ers.usda.gov/topics/crops/corn-and-other-feed-grains/feed-grains-sector-at-a-glance/ (Accessed June 30, 2024). See also Steven Ramsey, Brian Williams, Philip Jarrell and Todd Hubbs, “Global Demand for Fuel Ethanol Through 2030,” USDA Economic Research Service Bioenergy No. (BIO-05), February 2023, https://www.ers.usda.gov/publications/pub-details/?pubid=105761 (Accessed June 30, 2024).
42 Ramandeep Kumar Sharma, Sunny Kumar, Kamal Vatta, Raju Bheemanahalli, Jagmandeep Dhillon and Krishna N Reddy, “Impact of recent climate change on corn, rice, and wheat in southeastern USA,” Sci Rep 12 (2022): 16928, https://doi.org/10.1038/s41598-022-21454-3 (Accessed June 30, 2024).
43 Ibid.
44 Ibid.
45 Chris Edwards, “Cutting Federal Farm Subsidies,” CATO Institute, Briefing Paper No. 162, August 31, 2023, https://www.cato.org/briefing-paper/cutting-federal-farm-subsidies (Accessed June 30, 2024)
46 Ellen T. Gray, “Climate Change Could Affect Global Agriculture within 10 Years,” NASA's Goddard Space Flight Center, 2021 (Updated May 2023), https://svs.gsfc.nasa.gov/13979#section_credits (Accessed June 30, 2024)
47 Jonas Jägermeyr et al., “Climate impacts on global agriculture emerge earlier in new generation of climate and crop models,” Nat Food 2 (2021): 873–885, https://www.nature.com/articles/s43016-021-00400-y#citeas (Accessed May 30, 2024).
48 Ibid.
49 Ibid.
50 Ibid.
51 K. Fuglie, “Climate change upsets agriculture,” Nat. Clim. Chang. 11 (2021): 294–295, https://doi.org/10.1038/s41558-021-01017-6 (Accessed June 30, 2024).
52 Intergovernmental Panel on Climate Change, “Climate Change 2023: Synthesis Report,” Contribution of Working Groups I, II and III to the Sixth Assessment Report of the Intergovernmental Panel on Climate Change” [Core Writing Team, H. Lee and J. Romero (eds.)]. IPCC, Geneva, Switzerland, pp. 35-11, https://www.ipcc.ch/report/ar6/syr/ (Accessed June 30, 2024).
53 Leal Filho, Walter, Murukesan Krishnapillai, Henry Sidsaph, Gustavo J. Nagy, Johannes M. Luetz, Jack Dyer, Michael Otoara Ha’apio, Peni Hausia Havea, Kushaal Raj, Priyatma Singh, et al., “Climate Change Adaptation on Small Island States: An Assessment of Limits and Constraints,” Journal of Marine Science and Engineering 9 no. 6 (2021): 602, https://doi.org/10.3390/jmse9060602 (Accessed June 30, 2024).
54 U.S. Department of Agriculture, “Food and Agricultural Import Regulations and Standards Country Report: Ethiopia,” 2022, https://apps.fas.usda.gov/ (Accessed June 30, 2024).
55 Hannah Ritchie, “How much of global greenhouse gas emissions come from food?” OurWorldInData.org, 2021, https://ourworldindata.org/greenhouse-gas-emissions-food (Accessed June 30, 2024).
56 FAO, “The future of food and agriculture – Alternative pathways to 2050,” Summary version. Rome, 2018, https://www.fao.org (Accessed June 30, 2024).
57 International Rice Research Institute, “Climate Change and Sustainability,” 2021, https://www.irri.org/our-work/impact-challenges/climate-change-sustainability
58 Stefano Menegat, Alicia Ledo, Reyes Tirado, “Greenhouse gas emissions from global production and use of nitrogen synthetic fertilisers in agriculture,” Sci Rep 12 (2022): 14490, https://doi.org/10.1038/s41598-022-18773-w (Accessed May 30, 2024).
59 Zewei Jiang, Shihong Yang, Xi Chen, Qingqing Pang, Yi Xu, Suting Qi, Wanqing Yu and Huidong Dai, “Controlled release urea improves rice production and reduces environmental pollution: a research based on meta-analysis and machine learning,” Environ Sci Pollut Res 29 (2022): 3587–3599, https://doi.org/10.1007/s11356-021-15956-2 (Accessed May 30, 2024).
60 Marcos Cortez Bacilio, “Agriculture Bio factories as a solution to bring back life to the soil,” Institute for Agriculture and Trade Policy, August 17, 2022, https://www.iatp.org/biofactories-solution-bring-back-life-soil (Accessed July 30, 2024); Adrian Muller, Christian Schader, Nadia El-Hage Scialabba, Judith Brüggemann, Anne Isensee, Karl-Heinz Erb, Pete Smith, Peter Klocke, Florian Leiber, Matthias Stolze and Urs Niggli, “Strategies for feeding the world more sustainably with organic agriculture,” Nat Commun 8 (2017): 1290, https://doi.org/10.1038/s41467-017-01410-w (Accessed July 30, 2024); see also Ammar EE, Rady HA, Khattab AM, Amer MH, Mohamed SA, Elodamy NI, Al-Farga A, Aioub AAA, “A comprehensive overview of eco-friendly bio-fertilizers extracted from living organisms,” Environ Sci Pollut Res Int. 30(53) (2023 November): 113119-113137, https://www.ncbi.nlm.nih.gov/pmc/articles/PMC10663222/ (Accessed July 30, 2024).
61 Giuliana Viglione, “Q&A: What does the world’s reliance on fertilisers mean for climate change?” Carbon Brief, November 7, 2022, https://www.carbonbrief.org/qa-what-does-the-worlds-reliance-on-fertilisers-mean-for-climate-change/ (Accessed May 30, 2024).
62 Yuanchao Hu, Meirong Su and Limin Jiao, “Peak and fall of China's agricultural GHG emissions,” Journal of Cleaner Production 389 (2023): 136035, https://doi.org/10.1016/j.jclepro.2023.136035 (Accessed May 30, 2024).
63 World Economic Forum, “China cut fertilizer use and still increased crop yields. This is how they did it,” March 26, 2018, https://www.weforum.org/agenda/2018/03/this-is-how-china-cut-fertilizer-use-and-boosted-crop-yields/ (Accessed May 30, 2024). See also Cui, Z., Zhang, H., Chen, X. et al, “Pursuing sustainable productivity with millions of smallholder farmers,” Nature 555 (2018): 363–366, https://doi.org/10.1038/nature25785 (Accessed May 30, 2024).
64 C.F.A. van Wesenbeeck, M.A. Keyzer, W.C.M. van Veen and H. Qiu, “Can China’s overuse of fertilizer be reduced without threatening food security and farm incomes?” Agricultural Systems 190 (2021): 103093, https://www.elsevier.com/locate/agsy (Accessed May 30, 2024).
65 Ibid.
66 Monica Bruckner, “The Gulf of Mexico Dead Zone,” https://serc.carleton.edu/ (Accessed May 30, 2024). See also The Nature Conservancy, “Gulf of Mexico Dead Zone” https://www.nature.org/ (Accessed May 30, 2024).
67 See by Jin Wang, Sai Kranthi Vanga, Rachit Saxena, Valérie Orsat and Vijaya Raghavan, “Effect of Climate Change on the Yield of Cereal Crops: A Review,” McGill University, Canada, https://www.mdpi.com/2225-1154/6/2/41 (Accessed May 30, 2024). See also Ashutosh Tripathi, Durgesh Kumar Tripathi, D.K. Chauhan, Niraj Kumar and G.S. Singh, “Paradigms of climate change impacts on some major food sources of the world: A review on current knowledge and prospects,” Agric. Ecosyst. Environ 2016 (2016): 356–373. See further Howden, S.M.; Soussana, J.-F.; Tubiello, F.N.; Chhetri, N.; Dunlop, M.; Meinke, H, “Adapting agriculture to climate change,” Proc. Natl. Acad. Sci. 104 (2007): 19691–19696.
68 FAO, “Agricultural production statistics 2000–2020,” FAOSTAT Analytical Brief 41. https://www.fao.org/3/cb9180en/cb9180en.pdf (Accessed May 30, 2024).
69 University of the Potomac, “Where Does Our Food Come From? The Largest Agri Producers and Exporters,” https://potomac.edu/where-does-our-food-come-from/
[70] OECD/FAO, “OECD-FAO Agricultural Outlook 2021-2030,” OECD Publishing, Paris, 2021, https://doi.org/10.1787/19428846-en (Accessed May 30, 2024)
71 FAO, “GIEWS - Global Information and Early Warning System Country Briefs – India,” 2023, https://www.fao.org/giews/countrybrief/country.jsp?code=IND&lang=en (Accessed May 30, 2024).
72 OECD/FAO, “OECD-FAO Agricultural Outlook 2021-2030,” OECD Publishing, Paris, 2021, https://doi.org/10.1787/19428846-en (Accessed May 30, 2024).
73 FAO, “World Food and Agriculture – Statistical Yearbook 2022,” Rome, 2022, https://doi.org/10.4060/cc2211en (Accessed May 30, 2024).
74 FAOSTAT, “Trade of agricultural commodities 2000–2020,” Analytical Brief 44, 2022. https://www.fao.org/3/cb9928en/cb9928en.pdf (Accessed May 30, 2024). The brief states that the Americas are the largest net exporter with USD133 billion surplus in 2020 while Asia is the largest net importer with a USD214 billion deficit in 2020.
75 U.S. Department of Agriculture, “Foreign Agricultural Trade of the United States (FATUS),” 2024, https://www.usda.gov/ (Accessed June 30, 2024).
76 OECD/FAO, “OECD-FAO Agricultural Outlook 2021-2030,” OECD Publishing, Paris, 2021 https://doi.org/10.1787/19428846-en (Accessed May 30, 2024).
77 USDA Foreign Agricultural Service, “Global Agricultural Trade System (GATS),” 2024. https://fas.usda.gov/data/commodities/corn (Accessed May 30, 2024).
78 Ibid.
79 USDA Foreign Agricultural Service, “Mexico Corn Near-Average Production Expected,” Commodity Intelligence Report, 2023, https://ipad.fas.usda.gov/highlights/2023/05/Mexico/index.pdf (Accessed May 30, 2024).
80 Timothy A. Wise, “Mexico defends GM corn restrictions with science,” IATP Brief, 2024, https://www.iatp.org/mexicos-science-based-defense-gm-corn-restrictions (Accessed June 30, 2024).
81 USDA Foreign Agricultural Service, “Grain and Feed Annual,” 2024 https://apps.fas.usda.gov/ (Accessed May 30, 2024).
82 Diego Oré, “In Mexico's cradle of corn, climate change leaves its mark,” Reuters, February 22, 2020, https://www.reuters.com/article/idUSKBN20F0OB/ (Accessed May 30, 2024).
83 UNU-WIDER, “Greenhouse Gas Emissions and China’s Agriculture Sector,” Helsinki: UNU-WIDER, 2023, https://www.wider.unu.edu/ (Accessed May 30, 2024).
84 O. Erenstein, M. Jaleta, K.A Mottaleb, K. Sonder, J. Donovan and HJ Braun, “Global Trends in Wheat Production, Consumption and Trade,” Reynolds, M.P., Braun, HJ. (eds) “Wheat Improvement,” Springer, Cham 2022 https://doi.org/10.1007/978-3-030-90673-3_4
[85 International Grains Council, “Supply and Demand,” https://www.igc.int/en/markets/marketinfo-sd.aspx (Accessed June 30, 2024).
86 USDA, “Wheat Production Data,” https://ipad.fas.usda.gov/cropexplorer/cropview/commodityView.aspx?cropid=0410000&sel_year=2023&rankby=Production (Accessed May 20, 2024).
87 Mordor Intelligence, “Wheat Market Size and Share Analysis – Growth Trends and Forecasts (2023 – 2028),” https://www.mordorintelligence.com/industry-reports/global-wheat-market-growth-and-trends (Accessed May 20, 2024).
88 The leading EU wheat producers by share of EU production are France (25%), Germany (15%), Poland (6%), Italy (5%) and Spain (4%).
89 Ying Shan, Lee, “High global food prices may finally see a bottom in 2024, says Oxford Economics,” Monday, April 22, 2024, https://www.cnbc.com/ (Accessed May 30, 2024).
90 FAO, “The Importance of Ukraine and the Russian Federation for Global Agricultural Markets and the Risks Associated With The War In Ukraine,” 2022, https://www.fao.org/3/cb9013en/cb9013en.pdf (Accessed May 30, 2024).
91 Mohamed Ramadan and Saker El Nour, “Should we achieve wheat self-sufficiency?” July 26, 2023, https://www.madamasr.com/en/2023/07/26/opinion/u/should-we-achieve-wheat-self-sufficiency/ (Accessed July 30, 2024).
92 Senthold Asseng, et al., “Can Egypt become self-sufficient in wheat?” Environ. Res. Lett. 13 (2018); 094012, https://iopscience.iop.org/article/10.1088/1748-9326/aada50/pdf (Accessed May 30, 2024).
93 U.S. Department of Agriculture, “Ethiopia is Expected to Export Wheat for the First Time as Summer Production Progresses Nicely,” October 25, 2022, https://apps.fas.usda.gov/ (Accessed May 30, 2024); See also Usman Kedir, “The Effect of Climate Change on Yield and Quality of Wheat in Ethiopia: A Review,” Journal of Environment and Earth Science 7, no. 12 (2017), https://core.ac.uk/ (Accessed May 30, 2024).
94 Jonathan Foley, “It’s Time to Rethink America’s Corn System,” Scientific America, 2023. https://www.scientificamerican.com/article/time-to-rethink-corn/ (Accessed May 30, 2024).
95 Ben Lilliston, “Biofuels and Development”, IATP, November 11, 2007, https://iatp.typepad.com/thinkforward/2007/11/agribusiness-an.html (Accessed May 30, 2024).
96 Abdullah Mamun and Joseph Glauber, “Rice markets in South and Southeast Asia face stresses from El Niño, export restrictions,” International Food Policy Research Institute (IFPRI), May 15, 2023. https://www.ifpri.org/blog/rice-markets-south-and-southeast-asia-face-stresses-el-ni%C3%B1o-export-restrictions (Accessed May 30, 2024).
97 Lee Ying Shan, “India’s rice export ban to hurt millions globally. These countries will be the worst hit,” CNBC, August 1, 2023, https://www.cnbc.com/ (Accessed May 30, 2024).
98 Edmond, Charlotte, “Rice is both a victim and a villain in terms of the climate crisis. Here’s why,” World Economic Forum, June 6, 2023, https://www.weforum.org/agenda/2023/06/rice-climate-crisis-food-security/ (Accessed May 30, 2024).
99 FAOSTAT, “Trade of agricultural commodities 2000–2020,” Analytical Brief 44, https://www.fao.org/3/cb9928en/cb9928en.pdf (Accessed May 30, 2024).
100 Jahi M Chappell, “Sustainable intensification is unsustainable,” IATP, 2014, https://www.iatp.org/blog/201409/%E2%80%9Csustainable-intensification%E2%80%9D-is-unsustainable (Accessed May 30, 2024).
[101 James M. MacDonald, Robert A. Hoppe and Doris Newton, “Three Decades of Consolidation in U.S. Agriculture,” EIB-189, U.S. Department of Agriculture, Economic Research Service, March 2018, https://www.ers.usda.gov/webdocs/publications/88057/eib-189.pdf?v=4218.7 (Accessed May 30, 2024).
102 USDA Economic Research Service, “Crop production in the Heartland has shifted to farms with at least 1,000 acres,” 2020, https://www.ers.usda.gov/ (Accessed May 30, 2024).
103 K.M. Dittmer, S. Rose, S.S. Snapp, et al, “Agroecology Can Promote Climate Change Adaptation Outcomes Without Compromising Yield in Smallholder Systems,” Environmental Management 72 (2023): 333–342. https://doi.org/10.1007/s00267-023-01816-x (Accessed May 30, 2024).
104 Kyle M Dittmer, Sabrina Rose, Sieglinde S Snapp, Yodit Kebede, Sarah Brickman, Sadie Shelton, Cecelia Egler, Milena Stier and Eva Wollenberg, “Agroecology Can Promote Climate Change Adaptation Outcomes Without Compromising Yield In Smallholder Systems,” Environ Manage 72(2) (20230: 333-342. doi: 10.1007/s00267-023-01816-x. Epub 2023 Apr 1. PMID: 37004534; PMCID: PMC10287806. https://pubmed.ncbi.nlm.vnih.gov/37004534/ (Accessed June 30, 2024)
105 Jikun Huang, Martin Piñeiro, Valeria Piñeiro, Kym Anderson, Nelson Illescas, David Laborde and Laura Wellesley, “Global food security and market stability: The role and concerns of large net food importers and exporters,” T20 Argentina: Food Security and Sustainable Development Task Force Brief, 2021, https://www.g20-insights.org/policy_briefs/global-food-security-and-market-stability-the-role-and-concerns-of-large-net-food-importers-and-exporters/ (Accessed May 30, 2024).
106 FAO, “The future of food and agriculture – Alternative pathways to 2050,” Rome, 2018, https://www.fao.org/3/CA1553EN/ca1553en.pdf (Accessed May 30, 2024).